Peptide FRET: Efficiency, Distance and Ensemble Limits
Interpret peptide FRET measurements with explicit efficiency models, label geometry, lifetime assumptions and limits on distance and structural inference.

Peptide FRET measures distance-sensitive energy transfer between specified labels; it does not directly measure a unique peptide fold or a residue-to-residue distance. Converting transfer efficiency into distance requires a suitable photophysical model, an applicable Förster radius and evidence about the labelled population. Flexible peptides can share one apparent efficiency while having different distance distributions and dynamics.
For laboratory research use only. This guide explains measurement interpretation, not human or veterinary use. All calculations below use hypothetical inputs and are not measurements of HealthyWelness materials.
- Förster resonance energy transfer is a nonradiative interaction between a donor and acceptor; detected acceptor light is a possible readout rather than the definition of transfer.
- The simple efficiency equation is nonlinear in donor–acceptor separation and depends on a specified Förster radius.
- A distance between dye centres is not automatically the distance between the peptide atoms used to attach them.
- A single efficiency can leave both population structure and conformational dynamics unresolved.
Identify the labelled system before calling it a molecular ruler
A figure shows a short peptide with a donor at one end and an acceptor at the other. A later figure shows higher acceptor-channel intensity, accompanied by the conclusion that the peptide became shorter. Several inferential steps lie between those pictures. Did the signal establish energy transfer? Did the transfer change because distance changed? What did the inferred distance describe? Each step needs its own evidence.
IUPAC’s definition describes Förster resonance energy transfer as a nonradiative, weak-coupling dipole interaction and gives the distance-dependent transfer-rate relationship. Its Förster radius also depends on orientation, donor quantum yield, spectral overlap and refractive index. Those dependencies explain why distance sensitivity does not make the method a ruler with an unconditional scale. IUPAC Gold Book, FT07381.
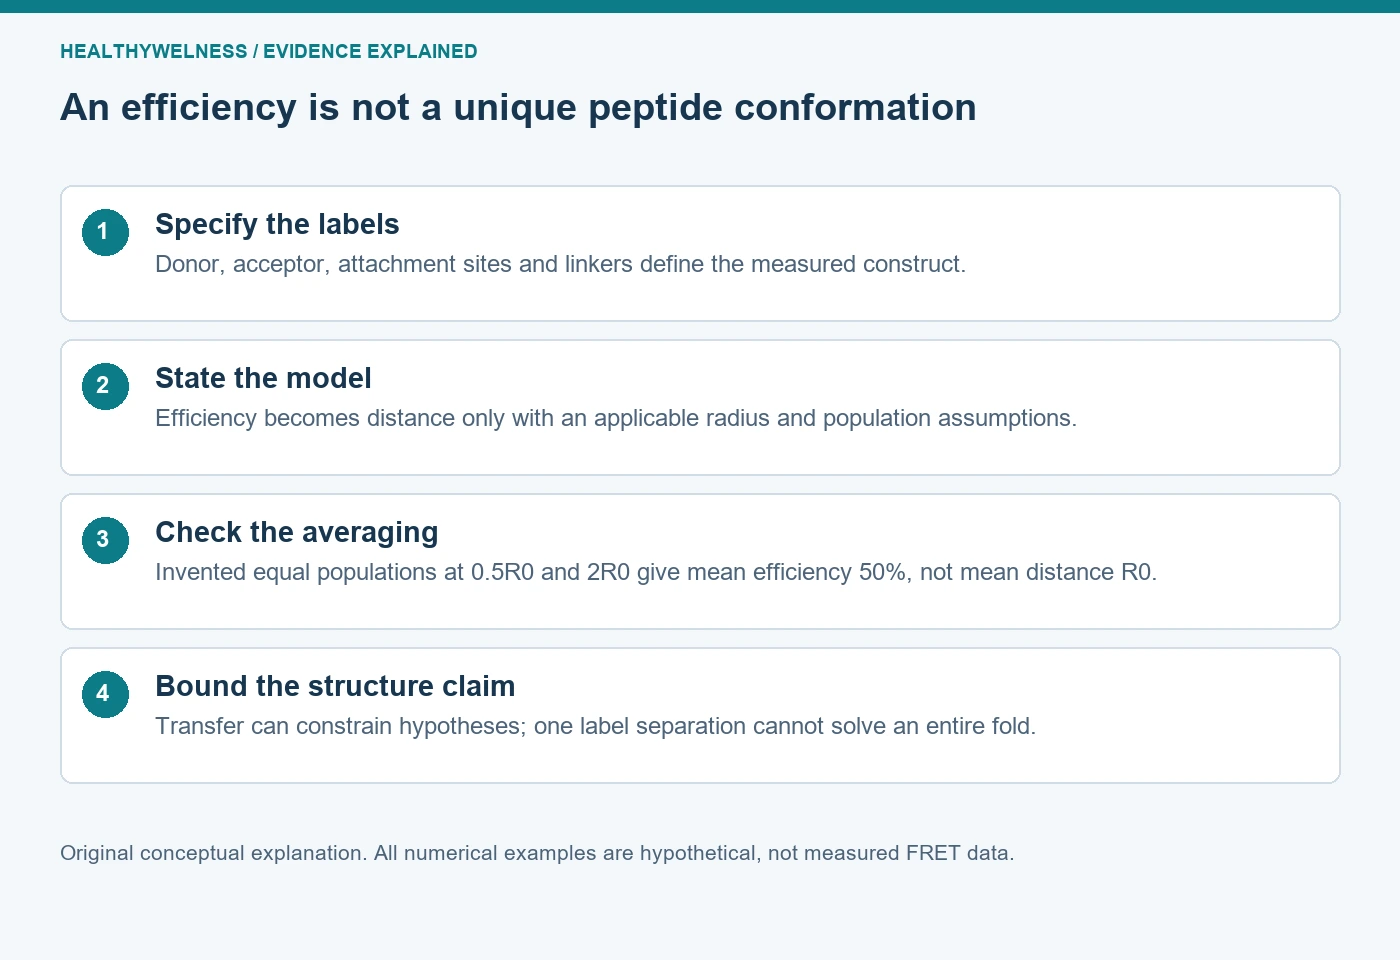
Record the donor and acceptor chemistry, attachment positions, linkers, intended peptide structure and preparation composition. A label attached through a flexible linker can explore positions around its attachment point. Even if the optical model establishes a dye-to-dye distance, translating it into a particular backbone geometry requires an additional structural model. The label drawing should not erase the linker.
Also distinguish intramolecular from intermolecular transfer. Labels on one chain can address an internal separation question. Labels on different chains can report proximity between chains. A preparation containing both possibilities requires a design that distinguishes them; a changing bulk signal cannot identify its molecular origin merely from the cartoon used to introduce the assay.
Make the efficiency equation and its assumptions explicit
For an idealized donor–acceptor pair with a fixed separation and applicable photophysical conditions, write E = 1 / [1 + (r/R0)6]. E is dimensionless transfer efficiency, r is the separation of the relevant label centres and R0 is the Förster radius for that model and environment. At r = R0, E is one half. This is a calculation within a defined model, not a way to assign a distance to any arbitrary fluorescence ratio.
The inverted expression is r = R0[(1/E) − 1]1/6. It yields a separation for the stipulated model. It cannot determine whether a sample actually contained one fixed separation, a mixture, changing orientations or an unresolved fraction without an acceptor. A precise numerical inverse does not supply the missing population information.
| r/R0 | Calculated efficiency | Interpretation within the model |
|---|---|---|
| 0.5 | 64/65 = 98.46% | Transfer close to saturation |
| 1 | 1/2 = 50.00% | Separation equals assumed R0 |
| 2 | 1/65 = 1.54% | Transfer contribution is small |
The table also shows why a useful measurement range belongs to the particular pair and experiment. Near either extreme, substantial changes in separation can correspond to comparatively small changes in efficiency. The table defines no universal distance-resolution claim. Uncertainty in efficiency and in R0 must remain attached to any derived distance.
A calculated mixture exposes the averaging problem
Invented two-state example: imagine equally populated donor–acceptor pairs at separations of 0.5R0 and 2R0. Stipulate the same donor properties and R0 for both populations, equal initial excitation weighting, and no exchange during the excited-state lifetime. These deliberately restrictive assumptions let us average their efficiencies for a transparent teaching calculation. They are not a claim about a real peptide.
The efficiencies are 64/65 and 1/65. Their equal-weight mean is exactly one half. Inverting that mean through the single-separation equation gives an apparent r of R0. However, the stipulated mean separation is (0.5 + 2)/2 = 1.25R0. With an invented R0 of 5 nm, those results are an apparent separation of 5 nm and a mean separation of 6.25 nm.
There is no arithmetic contradiction. Averaging a nonlinear function and then inverting it does not generally recover the average of its input. The example is also not an experimental recipe for extracting populations: unequal excitation, differing label properties, exchange and other heterogeneity require their own treatment.
A single population fixed at r = R0 also gives E = 0.5 in this model. Thus one exact, noiseless efficiency leaves at least these two invented descriptions unresolved. Improving numerical precision at that same summary cannot distinguish them. The scientific question requires additional information about distributions or dynamics.
Original peptide research shows why motion belongs in the model
Toptygin, Chin and Hilser’s 2015 original study combines theoretical treatment with time-resolved observations of a flexible tetradecapeptide in aqueous solution. It addresses rotational and translational diffusion and donor decay that need not be monoexponential. Its abstract and opening analysis explain why an efficiency alone cannot generally recover the mean donor–acceptor distance in a flexible population. Toptygin and colleagues, original research.
The study is useful here as evidence that flexibility is part of the measurement problem, rather than merely an imprecise drawing. It does not validate its detailed model for every labelled research peptide. This article uses the abstract and introductory equations, not an independent assessment of all later numerical methods, experimental fits or supporting information.
Motion on the fluorescence timescale and a distribution that remains effectively static on that timescale are different physical cases. A long instrument acquisition can combine many molecular events without making the excited-state dynamics irrelevant. Preserve the distinction between the duration of data collection and the much shorter processes governing transfer after excitation.
A lifetime change is informative under its own conditions
For the simple matched, single-population case, suppose transfer adds a donor decay pathway while the donor’s other decay behavior remains unchanged. Then E = 1 − τDA/τD, where τD is the donor lifetime without the acceptor and τDA is its lifetime with the acceptor. This statement includes its assumptions: a generic fitted lifetime from a heterogeneous decay cannot automatically be substituted into this expression.
Hypothetical example: τD = 4 ns and τDA = 3 ns give E = 0.25. With a separately stipulated R0 of 5 nm and the same single-separation model, r = 5 × 31/6 ≈ 6.00 nm. Reporting 6.00 nm without the assumptions would conceal more information than the displayed decimal places provide.
A lifetime can change for reasons other than transfer. If the donor’s environment or another decay pathway changes between the reference and comparison, the interpretation needs corresponding evidence. A donor-only comparison under relevant conditions asks a different question from an acceptor-only optical background. Neither should be described as covering every possible artifact.
Keep measured channels separate from derived efficiency
The BioTek technical white paper now hosted by Agilent explains several FRET readouts, including donor/acceptor intensities and fluorogenic peptide-cleavage assays. Its issues section discusses optical-filter selection and direct acceptor excitation. These are first-party technical explanations, not independent validation of a commercial peptide or a universal correction procedure. Held, introductory technical white paper.
Detected acceptor-channel light can include direct excitation and donor emission leaking into that window. A raw channel ratio therefore does not automatically equal E. Keep the component signals, control definitions and any correction model visible. The existing fluorescence-interference guide explains optical alternatives; the distinct question here is what an established transfer efficiency can support about distance.
A donor–quencher substrate that brightens after proteolysis also needs a reaction-specific interpretation. Separation of labels can be the intended reporter mechanism, yet the fluorescence change is not itself a sequence-resolved cleavage map. Product identification or other discriminating evidence addresses which chemical event caused separation. The cleavage-site guide follows that evidence chain.
Separate a conformational conclusion from a labelled-probe result
If a peptide carries dyes that its unlabelled counterpart lacks, the measured species is the labelled construct. Its identity, labeling distribution and any residual free label belong in the evidence record. A clear optical signal does not establish that labeling leaves every property of the original peptide unchanged.
A careful conclusion might state that a particular labelled preparation shows a transfer change consistent with altered label separation under the model. Establishing an altered peptide fold requires enough structural information to distinguish that explanation from orientation, environment, association or population changes. No single donor–acceptor separation supplies all atom positions.
Complementary methods can answer different parts of the question. NMR assignment and restraints can support atom-specific structural statements, while CD spectra address ensemble optical evidence. Combining observations is useful when their species and conditions are comparable; putting unrelated measurements beside one another does not establish that comparability.
The analytical-document lookup helps locate available material records. It does not imply that a catalog item has FRET characterization, an established dye-distance distribution or a solved conformation. The scope of a real report follows its actual methods and observations.
Frequently asked questions
Does higher acceptor intensity always mean a shorter peptide?
No. First establish how the measured channels relate to transfer. Even a supported efficiency change depends on label properties and population assumptions before it can be interpreted as a distance change.
Is the FRET distance measured between attachment residues?
The simple relationship concerns the relevant donor and acceptor centres. Linkers and label geometry separate those locations from peptide attachment atoms, requiring a structural model for translation.
Does one efficiency determine a mean distance in a flexible peptide?
Not generally. Nonlinear averaging, distance distributions and dynamics matter. The two-state hypothetical example produces the same efficiency as a single different separation.
Does a donor lifetime reduction prove energy transfer?
It is compatible with an additional decay pathway, but the relevant controls and model must establish the cause. Other changes in donor environment or decay behavior can affect lifetime.
Can FRET establish an entire peptide fold?
A distance-sensitive observation can constrain structural hypotheses. A complete fold requires sufficient independent information, suitable modeling and an explicit account of unresolved alternatives.
For laboratory research use only. The examples are educational calculations, not commercial-batch measurements, product-performance claims or human or veterinary recommendations.
Cover and evidence map: original conceptual editorial schematics, not measured results, exact molecular structures, or photographs of HealthyWelness facilities.
Sources
- IUPAC Gold Book. Forster-resonance-energy transfer. FT07381
- Toptygin D, Chin AF, Hilser VJ. Effect of Diffusion on Resonance Energy Transfer Rate Distributions. J Phys Chem B. 2015. PMID26358033
- Held P. An Introduction to FRET Technology and its Application in Bioscience. BioTek/Agilent technical white paper 5994-2773EN