Peptide Freeze Concentration: Spatial Gradients Matter
Understand freeze concentration in peptide research, distinguish local exposure from bulk averages and assess what frozen-sample measurements mean.

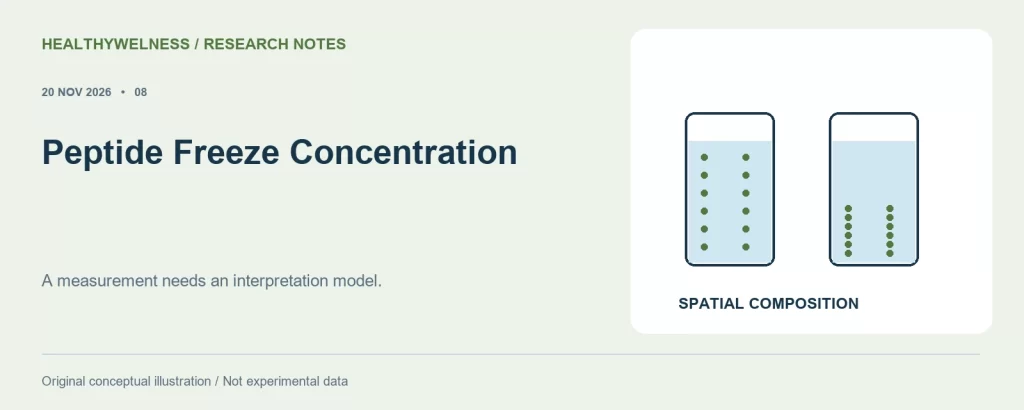
A freeze–thaw count does not describe the concentration gradients a peptide preparation encountered while ice formed. Solutes can redistribute between ice-rich and concentrated regions, and the outcome depends on formulation, geometry and thermal history. A representative measurement after complete thawing answers a different question from a local measurement during freezing or partial thawing.
For laboratory research use only. The compounds discussed are not approved for human or veterinary use and are not drugs, foods or cosmetics. This article summarises published research and is not medical advice.
- Ice formation can concentrate solutes in the remaining liquid without increasing the total amount of peptide in the container.
- Protein freezing studies have measured spatial differences in protein and buffer-component concentrations within a single frozen preparation.
- A post-thaw bulk pH value cannot reconstruct every local condition encountered during freezing.
- Protein model studies identify questions for peptide research; they do not establish a universal peptide freezing rate or storage period.
The container average can hide a local exposure
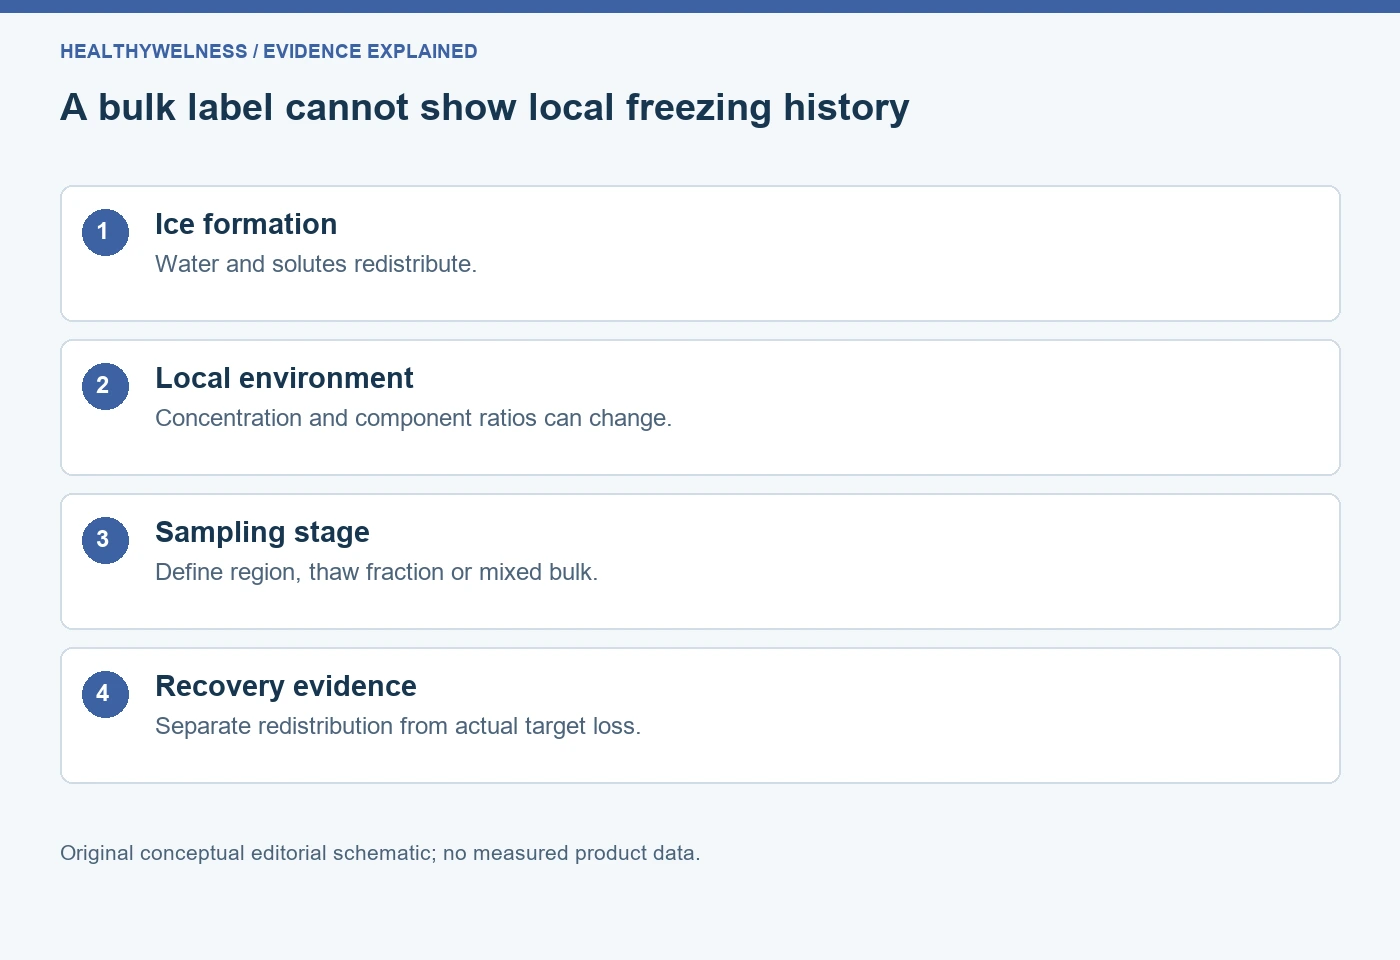
Freezing is often recorded as an event: one freeze, one thaw, one freezer temperature. Those entries are useful but incomplete. As water becomes ice, the liquid environment changes in space and time. The concentration calculated from the original amount and volume describes the original bulk preparation, not necessarily the material between growing ice regions.
This is a distribution problem as well as a stability problem. A solution can contain the same total amount of target while a particular region contains more target per volume than another. If a sample is taken from only one region, a concentration difference might reflect redistribution. If target is lost or chemically changed, redistribution alone is insufficient to explain it. The experiment must distinguish these possibilities.
| Observation stage | Quantity observed | Question left open |
|---|---|---|
| Initial mixed liquid | Starting bulk concentration | Later local exposure |
| Frozen local region | Regional composition | Whole-container average |
| Partial thaw fraction | Collected liquid fraction | Remaining frozen material |
| Fully thawed mixed bulk | Recovered bulk average | Transient frozen-state history |
The existing reconstituted peptide storage guide covers general storage choices. This article examines why an average concentration and a count of freezing events cannot establish spatial uniformity or identify the conditions responsible for a later difference.
Three original protein studies reveal different parts of the problem
Roessl, Leitgeb and Nidetzky studied bovine serum albumin in a temperature-controlled 200 mL container. They combined regional concentration measurements with microscopy of fluorescently labeled albumin. Their work found that freezing conditions changed both macroscopic distribution and the microscopic appearance of concentrated protein regions. The material was albumin, not a short research peptide. [1]
Reinsch and colleagues examined a Tris-buffered preparation containing horseradish peroxidase in bottle freezing experiments. They measured regional buffer components and monitored pH during freezing. Salt redistribution and pH behavior had to be considered together when interpreting enzyme activity. The study’s value here is its separation of composition, location and activity; its formulation is not a general peptide preparation recommendation. [2]
Spadiut and colleagues used an immunoglobulin G formulation in a small-scale freezing system. They evaluated regional protein concentration, conductivity, pH and soluble aggregates. Importantly, their thawed samples did not show the same kind of pH differences that one might expect from a simple universal freezing narrative. Several quantities were needed to describe the system. [3]
These studies do not supply one transferable damage percentage. Albumin, an enzyme preparation and an antibody differ from one another and from small peptides. What transfers is a method of reasoning: document geometry and thermal history, define the sampled region, and connect the analytical endpoint to the claim. The quantitative behavior remains material and formulation specific.
A conserved-solute calculation explains concentration without added mass
Invented ideal model: start with 1.00 mL of solution containing 1.00 mg of an unnamed target and 10.0 µmol of a hypothetical dissolved cosolute. Assume the target and cosolute remain entirely in the liquid fraction, no material degrades or adsorbs, and liquid-volume fractions are stipulated. Ignore volume expansion, crystallization of solutes, nonideal behavior and separate domains.
| Stipulated liquid fraction | Liquid volume | Target in liquid | Cosolute in liquid |
|---|---|---|---|
| 100% | 1.00 mL | 1.00 mg/mL | 10.0 mM |
| 50% | 0.50 mL | 2.00 mg/mL | 20.0 mM |
| 20% | 0.20 mL | 5.00 mg/mL | 50.0 mM |
| 10% | 0.10 mL | 10.0 mg/mL | 100 mM |
In this model, concentration in the remaining liquid equals initial concentration divided by its volume fraction. The amount of target remains 1.00 mg throughout. At a liquid fraction of 0.20, the target and cosolute concentrations are each five times their initial values. This is conservation arithmetic, not a prediction that a real frozen peptide reaches any listed concentration.
The assumptions intentionally exclude the features that complicate real freezing: solute incorporation or trapping, precipitation, different redistribution of different components and local variation in ice growth. If those features occur, one common multiplier may fail. The value of the simple example is to show why a cold sample can encounter a concentrated environment even though nobody added more peptide or salt.
It also explains why a fully thawed, mixed sample can return to its starting nominal concentration. Recombining the stipulated solvent restores the original volume. That reversal of concentration does not demonstrate reversal of an association or chemical change that occurred during the concentrated interval. Restoration of one bulk property and preservation of molecular material are distinct claims.
pH history and post-thaw pH are different evidence
A pH reading obtained after complete thawing describes the preparation at that measurement stage and temperature. It does not directly measure the liquid between ice regions earlier in the process. If components redistribute differently, their ratios can change locally. If the buffer equilibria are temperature sensitive, cooling introduces another influence.
The Reinsch study measured pH during freezing at defined positions, whereas the Spadiut study includes pH measurements in thawed regional samples. Those observation designs should not be collapsed into a single interchangeable endpoint. A comparison must preserve when and where pH was measured. [2,3]
Nor does unchanged bulk pH prove unchanged peptide concentration. Salt concentration, protein distribution and buffer response are separate quantities. Conversely, a changed pH does not identify the precise molecular pathway responsible for a recovered target difference. It is environmental evidence that must be connected to an appropriate chemical or physical measurement.
See what pH temperature compensation corrects for the distinction between sensor response and solution chemistry. A meter correction cannot recreate an unmeasured frozen-state trajectory.
Sampling can create a misleading recovery comparison
Imagine two portions collected from different positions of one frozen preparation. If one portion contains more target, the difference does not establish that the other portion degraded. A whole-container amount balance and a defined sampling design are needed to assess redistribution separately from loss. Measuring only a high-concentration fraction can likewise overstate recovery if its volume is ignored.
A partially thawed sample creates a related problem. The liquid collected at that stage is an operational fraction, not automatically a representative aliquot of the original whole. Its composition must not be inferred solely from the starting label. Whether the relevant experimental method requires complete thawing and a specific mixing step should be defined and validated for that material.
- Identify whether the sample represents the whole container, a spatial region or a collected thaw fraction.
- Retain the amount or volume of each fraction when calculating recovery.
- Use an analysis suitable for the target and the relevant physical or chemical endpoint.
- Document any step that excludes particles or changes the fraction reaching the detector.
For example, a chromatogram from the sampled liquid may characterize recovered soluble material while missing an excluded particulate fraction. A high main-peak percentage in that chromatogram does not establish complete target recovery. The SEC aggregation and recovery guide explains this analytical boundary.
Why one universal freezing rate would overstate the evidence
Freezing rate can influence more than one stress. Thermal gradients, ice morphology, duration of exposure to concentrated liquid and contact with interfaces can change together. A rate that improves a particular distribution measurement in one system is not automatically the rate that best preserves every peptide endpoint in another.
Container geometry and fill volume matter because the freezer setpoint is not the sample temperature everywhere at once. A small aliquot and a larger bottle can share a nominal freezer temperature while following different internal trajectories. A record that includes only the appliance setting cannot establish matched thermal exposure.
A focused comparison should therefore hold formulation and geometry sufficiently consistent, describe the actual freezing and thawing history, and assess the endpoints needed by the research question. If several factors change simultaneously, report that limitation. The studies cited here motivate such comparisons; they do not validate a local peptide procedure simply because it uses a colder freezer or fewer freezing events.
For nominal starting concentration, the peptide concentration calculator checks mass–volume arithmetic. It does not calculate ice fraction, spatial distribution or frozen-state pH. HealthyWelness operates a commercial research-material catalog, and this explanation reports no product-specific freezing experiment or assigned storage interval.
Questions about concentration during freezing
Does one freeze mean the same exposure for every sample?
No. Formulation, fill volume, geometry and thermal history can differ within the same event count. Count freezing events while preserving those other details.
Does freeze concentration increase the total peptide amount?
No. Redistribution can raise local concentration without adding target. Total recovery requires an amount balance across the relevant preparation and fractions.
Can a normal post-thaw pH exclude a temporary pH change?
No. A post-thaw measurement does not reconstruct earlier local pH. Its conclusion applies to the sampled material at the stated measurement stage.
Can antibody freezing data set a short peptide’s storage period?
No. Antibody studies reveal mechanisms and measurement approaches. A storage-period claim requires evidence for the actual peptide, formulation, conditions and endpoints.
Is a clear thawed solution proof that freezing changed nothing?
No. Visual clarity does not establish molecular identity, complete recovery or unchanged association state. Select measurements that address the intended conclusion.
References
- Roessl U, Leitgeb S, Nidetzky B. Protein freeze concentration and micro-segregation analysed in a temperature-controlled freeze container. Biotechnol Rep. 2015;6:108–111. PMID: 28626703.
- Reinsch H, et al. Examining the freezing process of an intermediate bulk containing an industrially relevant protein. Enzyme Microb Technol. 2015;71:13–19. PMID: 25765305.
- Spadiut O, et al. Spatially Resolved Effects of Protein Freeze-Thawing in a Small-Scale Model Using Monoclonal Antibodies. Pharmaceutics. 2020;12(4):382. PMID: 32326286.
For laboratory research use only. The compounds discussed are not approved for human or veterinary use and are not drugs, foods or cosmetics. This article summarises published research and is not medical advice.
Cover and evidence map: original conceptual editorial schematics, not measured results, exact molecular structures, or photographs of HealthyWelness facilities.
Sources
- Roessl U, Leitgeb S, Nidetzky B. Protein freeze concentration and micro-segregation analysed in a temperature-controlled freeze container. Biotechnol Rep. 2015;6:108–111. PMID: 28626703.
- Reinsch H, et al. Examining the freezing process of an intermediate bulk containing an industrially relevant protein. Enzyme Microb Technol. 2015;71:13–19. PMID: 25765305.
- Spadiut O, et al. Spatially Resolved Effects of Protein Freeze-Thawing in a Small-Scale Model Using Monoclonal Antibodies. Pharmaceutics. 2020;12(4):382. PMID: 32326286.