Peptide Assay Normalization: Fold Change and References
Interpret normalized peptide assay signals, fold ratios and percent changes by checking backgrounds, control denominators and aggregation rules.


Normalization expresses an assay result relative to a stated reference or scale; fold change is a ratio whose meaning depends on that denominator. A peptide result described as “twofold” is incomplete without the measured endpoint, background treatment, reference condition, aggregation rule and experimental unit. A mathematically tidy ratio can still reflect an unstable control, detector interference or a changed biological reference.
- A fold ratio, a percentage increase and a percentage of a control-defined range are different quantities.
- Background subtraction changes the quantity being compared; it should be justified and documented.
- Dividing by a reference does not establish that the reference was stable or appropriate.
- Raw measurements, control values and normalized results should remain traceable to one another.
Start with the equation behind the axis label
“Normalized response” may mean division by an untreated control, subtraction of a baseline, scaling between low and high controls, adjustment to cell number or a transformation of log intensities. These operations can be reasonable for different questions. They are not equivalent simply because each produces dimensionless numbers.
The Assay Guidance Manual distinguishes raw, normalized and derived assay results. It defines reference-dependent functional readouts and warns that the chosen reference agonist can change apparent relative efficacy across assays. Its discussion concerns defined assay contexts rather than a universal conversion from detector signal into biological response. [1]
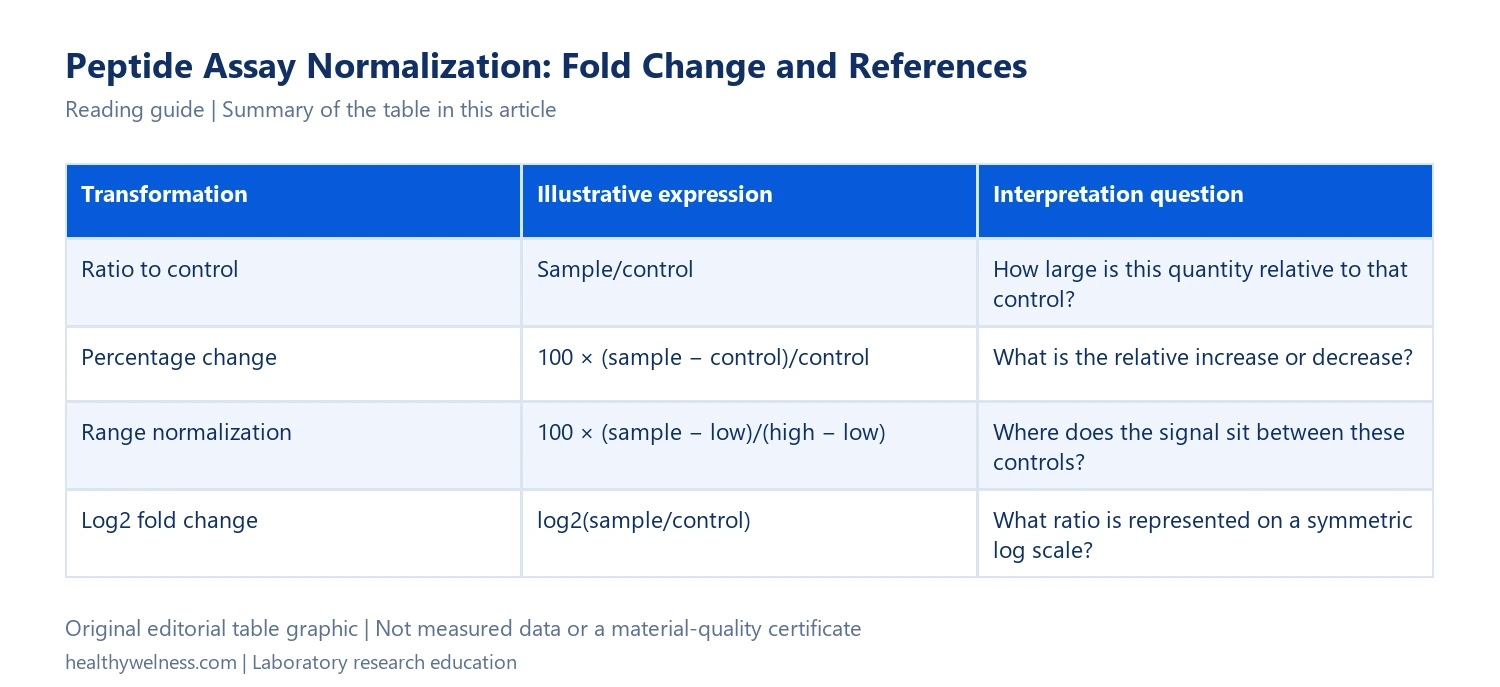
| Transformation | Illustrative expression | Interpretation question |
|---|---|---|
| Ratio to control | Sample/control | How large is this quantity relative to that control? |
| Percentage change | 100 × (sample − control)/control | What is the relative increase or decrease? |
| Range normalization | 100 × (sample − low)/(high − low) | Where does the signal sit between these controls? |
| Log2 fold change | log2(sample/control) | What ratio is represented on a symmetric log scale? |
These expressions assume the required divisions and logarithms are meaningful for the supplied quantities. A zero denominator, a negative background-corrected value or an unquantifiable control requires more than a formatting decision. An analysis should not silently insert a convenient constant just to obtain a finite result.
One hypothetical signal can produce several correct numbers
Suppose a detector records a background of 20 units, an untreated control of 100 units and a peptide-exposed sample of 180 units. The raw signal ratio is 180/100 = 1.8. Expressed as a percentage increase from the raw control, that is 80%, not 180%.
If an additive background of 20 is justified for both measurements, the corrected quantities are 80 and 160 units. Their ratio is 2.0 and their percentage increase is 100%. No new experimental response was created by subtraction: the calculation now describes signal above the specified background rather than total recorded signal. The two ratios answer different questions.
Calling either result simply “twofold activation” would conceal important information. The source of the 20-unit background must be stated: an instrument blank, a matrix blank and a sample-specific interference control are not automatically interchangeable. If the peptide itself changes the optical signal independent of the biological process, subtracting a single common blank may fail to resolve that interference.
The useful record therefore contains the observed signal, the control’s signal, the background definition and the exact transformation. A reader can then reproduce the arithmetic while separately judging the biological interpretation.
A percentage of the assay range is not a fold increase
Consider another invented comparison. Low-control signal is 100 units, high-control signal is 500 units and the sample is 300 units. The sample occupies 100 × (300 − 100)/(500 − 100) = 50% of that control-defined range. It is also three times the uncorrected low-control signal. Fifty percent of range and threefold of baseline are both arithmetic descriptions, but they are not substitutes.
Now keep the low control and sample at 100 and 300 while changing the high-control value to 900. Range normalization yields 25%. This hypothetical change could represent a different reference response or assay state; it does not, by arithmetic alone, show that the sample’s underlying biological action was halved. The denominator changed from 400 to 800 units.
The HTS Assay Validation chapter uses plate-specific low and high controls when calculating normalized activity, and defines percent inhibition as 100 minus percent activity in the relevant inhibition format. It also evaluates raw spatial patterns and normalized consistency. This supports reading controls and raw signals alongside percentages; it does not make every control-normalized plate valid. [2]
Normalizing across runs requires a reason the reference travels
Suppose all signals in a second run are exactly twice those in the first because of a hypothetical multiplicative detector gain. Dividing both sample and reference by the same positive gain cancels that particular factor. This is the idealized reason a ratio can help comparisons.
The cancellation does not cover every disturbance. An additive offset does not disappear from an uncorrected ratio. Saturation is not a common multiplier. A reference-specific change does not affect the sample and denominator equally. Nor can division separate a true sample difference from a technical batch effect when the sample condition and batch are perfectly confounded.
For example, a reference signal of 100 with a sample of 150 gives 1.5-fold. A drifting reference of 75 with the same sample signal gives 2.0-fold. The larger ratio alone does not identify whether the sample changed, the reference changed or both did. A normalized plot that hides its controls removes the information needed to consider these possibilities.
“Average fold change” needs an aggregation rule
Imagine two genuinely paired laboratory comparisons. Pair A has control 10 and sample 20; pair B has control 100 and sample 110. Each pair increases by ten units, but the ratios are 2.0 and 1.1. The arithmetic mean of the pairwise ratios is 1.55.
The ratio of the arithmetic group means is different: the sample mean is 65, the control mean is 55 and their ratio is approximately 1.18. Neither calculation contains an arithmetic error. The first gives each pair’s ratio equal weight; the second is a ratio of two pooled summaries and gives larger baseline values a different influence.
If an analysis is based on log ratios, the mean log2 ratio corresponds here to a geometric mean ratio of the square root of 2.2, approximately 1.48. This third summary is yet another precisely defined quantity. The appropriate choice depends on the scientific contrast, pairing, sampling model and error structure. Selecting whichever summary looks largest after seeing the data changes the analysis question.
A clear figure legend identifies whether values are ratios per independent preparation, ratios of group means or back-transformed estimates from a model. It also describes how uncertainty was obtained on that scale. The label “fold change ± error” does not provide those details.
A shared denominator creates shared uncertainty
When ten sample wells are divided by the same estimated control mean, the control contributes to all ten ratios. Its uncertainty has not vanished because every control bar was displayed as one. Treating those ratios as independent biological preparations can understate the role of the shared reference and the actual experimental design.
This is especially important when technical wells are nested within the same preparation or experimental run. Replicate type, pairing and run should be retained through analysis. Normalization is a transformation of observations; it is not a procedure for generating additional independent evidence.
A useful reporting approach presents the distribution or run-level estimates on an appropriate scale while preserving the raw-to-normalized mapping. The exact statistical model requires the actual design and data. This educational example does not prescribe a single error-bar calculation for all ratio measurements.
What normalization cannot establish
A large fold change can arise from a very small denominator. Conversely, a large absolute difference can look modest when the baseline is large. Neither observation establishes practical relevance without the endpoint’s scale, variability and research context.
Normalization also cannot turn a nonlinear detector into a concentration assay, identify the responsible molecular species or establish an unmeasured mechanism. A signal of twofold remains a twofold change in the defined quantity until independent evidence supports a stronger interpretation.
When reviewing a peptide-assay figure, reconstruct one displayed result from its raw inputs if available. Ask whether both numerator and denominator were measured within a suitable range, whether background handling was consistent, and whether different runs used genuinely comparable references. These checks clarify what the number says without pretending that arithmetic alone validates the experiment.
FAQ
Is twofold the same as a 200% increase?
No. A ratio of two is 200% of the reference and a 100% increase over it. Authors should distinguish “percent of control” from “percent change.”
Should background always be subtracted before calculating a ratio?
No universal rule applies. The background must represent an appropriate contribution to the measured signal, and the resulting quantities must support the intended calculation.
Why can the same sample have different normalized percentages?
Percentages depend on their reference or scale. Different low/high controls, background definitions or reference responses can change the reported percentage.
Does setting the control to one remove its variability?
No. It sets a display reference. The estimated control and any shared denominator still contribute uncertainty to comparisons.
Can normalization correct every batch effect?
No. It may address a justified technical component, but it cannot automatically resolve nonlinear effects, reference-specific changes or confounding of experimental condition with batch.
Related reading
- Paired versus unpaired peptide experiments
- Controls and replicates
- Fluorescence interference in peptide assays
For laboratory research use only. This article concerns evidence interpretation and hypothetical research examples. It provides no instructions for human or veterinary use and no product-testing or efficacy claims.
Cover: AI-generated conceptual editorial artwork, not an exact molecular structure, measured result or a photograph of HealthyWelness staff or facilities.