Peptide Adsorption to Labware: Reading Recovery Evidence
Learn how research evidence separates peptide adsorption from aggregation, why labware comparisons need matched conditions, and how to assess recovery.


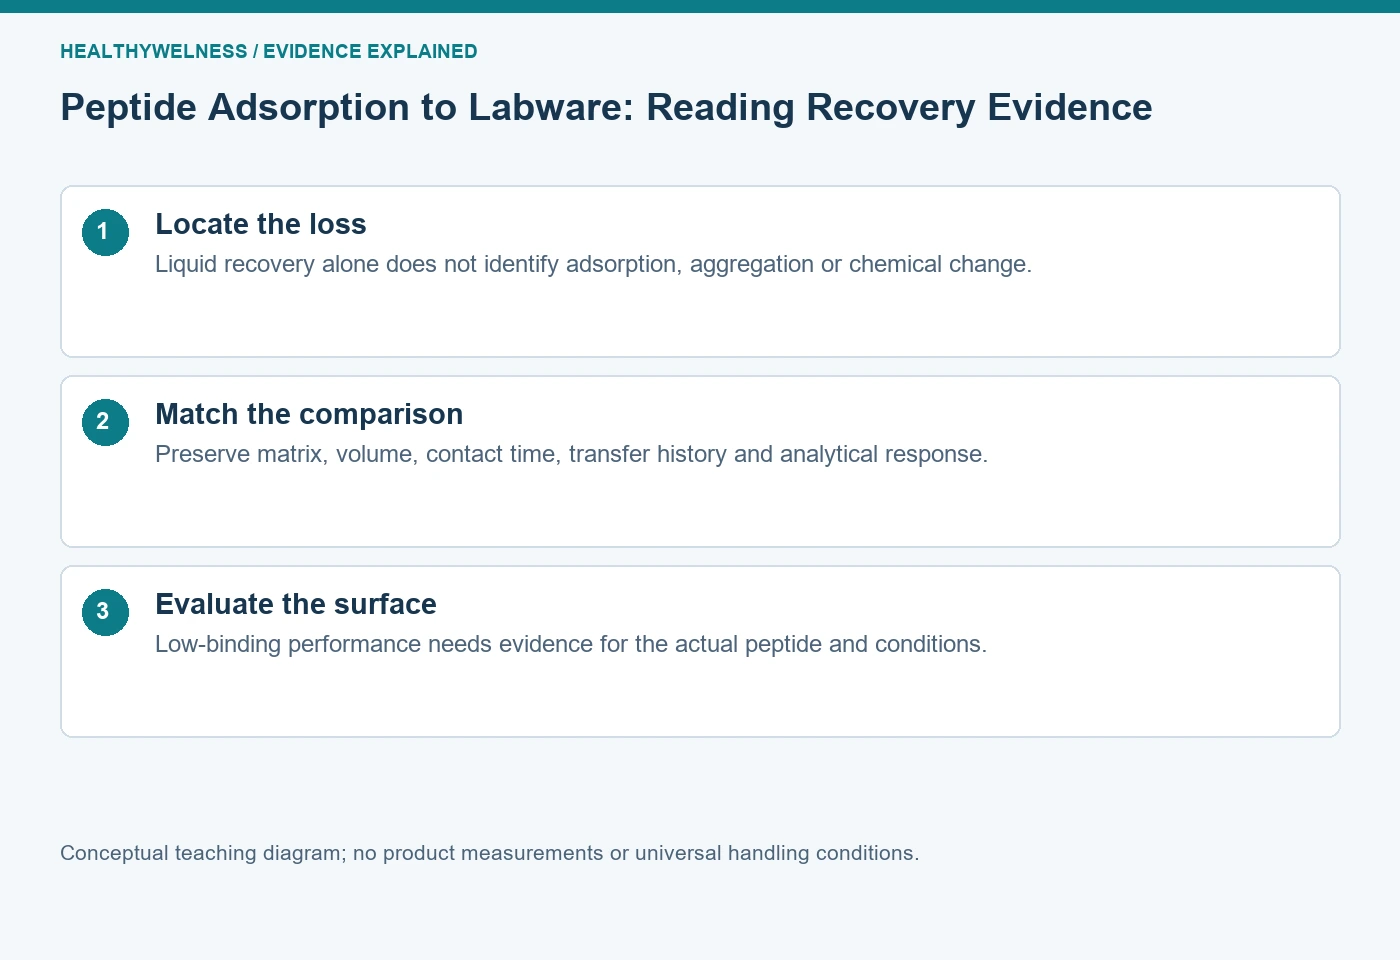
Peptide adsorption is association with a surface; aggregation is association among peptide molecules. Both can lower the amount recovered from a sampled liquid, and they can coexist. A weaker analytical signal does not identify either mechanism. Evaluate the container, contact history, target-specific recovery and measurement controls before attributing loss to labware or choosing a low-binding surface.
- Adsorption concerns a peptide–surface interaction, whereas aggregation concerns peptide–peptide association.
- Liquid-phase recovery and chemical purity are different measurements with different denominators.
- A low-binding labware claim applies to tested materials and conditions; it is not a promise of complete recovery for every peptide.
- A container comparison must keep the analytical method and relevant contact history comparable.
First define where the peptide is missing
A preparation begins with an assigned peptide amount, but only a portion may eventually reach an analytical detector. Some target may remain on a vessel wall; some may form suspended or settled assemblies; some may change chemically. Transfer, sampling and detection can also change the reported result. Calling the entire difference “adsorption” skips the investigation that would distinguish these explanations.
The useful starting claim is deliberately narrower: less target was recovered in the specified liquid fraction after the defined handling history. This describes what was measured without choosing a cause. Next ask which comparison could discriminate between surface association and another explanation. The aim is not to order every available test, but to make the next measurement answer the unresolved question.
| Observation | Question addressed | Important limit |
|---|---|---|
| Target amount in liquid | How much reached sampling? | Does not locate missing target |
| Target in a wall extract | Is target surface-associated? | Extraction recovery needs assessment |
| Particle-associated signal | Are larger entities present? | Composition remains unresolved |
| New chemical species | Did composition change? | Not every impurity is detected equally |
A surface can also participate in assembly formation. Therefore, “adsorption or aggregation” need not be an exclusive choice. An investigation can establish a contribution from a wall without proving that every remaining molecule is monomeric. Conversely, a particle signal can coexist with substantial wall loss.
What the direct cationic-peptide experiment establishes
Kristensen and colleagues examined mastoparan X, melittin and magainin 2 in borosilicate glass, polypropylene and Protein LoBind containers. Their original 2015 study used analytical HPLC and defined concentration, volume, incubation and transfer conditions. Recovery depended on the peptide, container and experimental circumstances. In the tested system, increasing concentration changed fractional recovery, and reducing surface area relative to liquid volume generally improved recovery in ordinary glass or polypropylene. [1]
The paper is particularly useful because its methods distinguish incubation from subsequent analytical handling and include a control addressing transfer-tip loss. That is stronger reasoning than seeing a lower peak and immediately blaming a tube. These findings concern three cationic peptides under specified conditions; they do not rank every surface for every sequence. The study supports testing contact-related loss, not copying one recovery percentage into an unrelated experiment.
Its practical lesson is a question: did the comparison change only the proposed surface interaction, or did it also change the route by which material reached the detector? A reference prepared in a different solvent, held for a different time or passed through fewer surfaces can create an apparently decisive difference whose explanation remains mixed.
Surface area and concentration belong in the same record
Think of a surface as presenting a finite and condition-dependent opportunity for association. The fraction of the total sample associated with that surface can be substantial when little material is present. A small fractional loss at one concentration therefore does not demonstrate negligible fractional loss at a much lower concentration. This is a conceptual inference, not a universal adsorption isotherm.
Geometry matters for the same reason. A shallow well, a narrow insert and a nearly full tube can expose different wetted areas per unit liquid. Equal liquid volumes do not guarantee equal contact areas. Comparing different formats is legitimate when choosing a complete workflow, but the conclusion should name the formats rather than pretending that only the polymer chemistry changed.
- Record container material, surface designation and format.
- Preserve actual liquid volume and nominal target concentration.
- Record contact time, temperature, mixing and number of transfers.
- Describe pH, salts, cosolvent and other components that may affect both surface interactions and the assay.
The metadata are explanatory variables. A conclusion that names only a commercial surface label cannot tell a second laboratory whether its own experiment reproduces the tested context.
Low-binding evidence needs a model and an endpoint
Eppendorf Application Note 180 describes fluorescence-labelled albumin recovery experiments and a separate angiotensin I MALDI-TOF comparison. Those are different model systems and endpoints. The manufacturer reports favourable performance under its tested conditions, but fluorescence recovery for labelled albumin is not a peptide-specific mass balance for an unnamed target. The note also discusses how surface-blocking additions can affect subsequent analyses. [2]
A Waters application brief follows selected tryptic-peptide peak responses during repeated LC-MS analysis of a four-protein digest. The brief compares specified glass and modified polypropylene vials and describes greater response loss for some hydrophobic peptides in glass over the observation period. It explicitly identifies itself as a brief without a detailed experimental section. Its evidence is useful within that design, while peak response alone does not independently resolve every possible physical or chemical mechanism. [3]
Read such documents as evidence for a candidate comparison, with the manufacturer’s commercial role visible. Neither document justifies the statement that a low-binding container prevents all adsorption, stabilizes every sequence or guarantees a particular assay result. Choose a surface because relevant comparative evidence supports the intended experiment, then retain the actual recovery evidence for that experiment.
A hypothetical container comparison separates amount from response
Invented teaching example: a laboratory assigns 100 pmol of an unnamed peptide to each of two matched preparations. Assume a suitable target-specific assay, independently evaluated extraction recoveries and comparable final volumes. Container A yields 60 pmol in the recovered liquid and 25 pmol in a wall-associated extract. Container B yields 88 pmol in liquid and 5 pmol in its wall extract.
The liquid recoveries are 60% and 88%, respectively. The accounted amounts are 85 and 93 pmol. Container B has 28 percentage points greater liquid recovery in this invented comparison, but 15 pmol in A and 7 pmol in B remain unexplained. It would be incorrect to assign all 40 pmol missing from A’s liquid to adsorption when the measured wall-associated fraction accounts for only 25 pmol.
Now change one assumption: suppose the wall extracts strongly suppress LC-MS response and the extraction calibration does not match that matrix. The arithmetic still sums, but the amounts no longer have the stated evidential basis. A neat numerical balance cannot repair a biased measurement. The example therefore requires both comparable quantity definitions and evaluated recovery of each fraction.
For a container decision, retain both the gain in recovered liquid target and the uncertainty in the missing fractions. A surface comparison can support choosing a candidate workflow without establishing the mechanism for every missing molecule. This example supplies no acceptance threshold and no predicted performance for a named commercial tube.
Choose the next comparison from the competing explanation
If a response difference appears immediately after transferring a freshly prepared solution, inspect the transfer path and analytical response before interpreting a long-term stability mechanism. If the difference grows with holding time in one format, compare relevant time points while checking whether evaporation or changing composition affects the result. If particles appear, examine their identity and sampling consequences instead of automatically counting them as degraded target.
A useful decision sequence is: define the missing fraction; verify that the quantitative method remains suitable in each matrix; compare contact histories; assess a relevant surface-associated fraction when feasible; and report the remaining uncertainty. Changing several variables can improve a working method, but it weakens a claim that one particular change caused the improvement.
Blocking agents, surfactants or organic components are not neutral troubleshooting tokens. They add a new matrix that may alter molecular association, detection or the experimental system itself. A successful rescue of signal should be checked for readout interference and retained target identity. An apparent rescue is evidence to investigate, not automatic proof of complete restoration.
Five questions about peptide loss on laboratory surfaces
Does a clear solution rule out adsorption?
No. A wall-associated fraction need not make the liquid visibly cloudy. Appearance does not quantify target remaining in solution or on the surface.
Does a low-binding label establish full recovery?
No. Low-binding performance is conditional on the tested peptide, matrix, format and contact history. A label does not replace a relevant recovery comparison.
Can adsorption and aggregation happen together?
Yes. Surface association and peptide–peptide association describe different interactions and can coexist. Evidence for one does not exclude the other.
Should higher analytical signal be called higher peptide amount?
Only when the quantitative method supports that interpretation in the compared matrices. Response differences can also reflect suppression, enhancement or other measurement effects.
Does unchanged purity show that no peptide was lost?
No. A normalized chromatographic area percentage can remain similar even when substantially less target reaches the detector. Recovery requires an appropriate amount-based comparison.
Connect container evidence with physical-state measurements
Read solubility versus stability for the broader loss mechanisms, DLS interpretation for particle evidence and LC-MS matrix effects for response versus recovery. Use the peptide concentration calculator for nominal mass–volume arithmetic; it cannot establish measured recovery. HealthyWelness operates a commercial research-material catalog. This article reports no product-specific labware testing.
References
- Kristensen K, Henriksen JR, Andresen TL. Adsorption of Cationic Peptides to Solid Surfaces of Glass and Plastic. PLOS ONE. 2015;10:e0122419.
- Eppendorf. Application Note 180: Evaluation of protein recovery in Protein LoBind tubes and plates.
- Hughes C, Gethings LA. Hydrophobic Peptide Recovery Improvements Using QuanRecovery Vials with MaxPeak HPS. Waters. 2019.
Cover and evidence map: original conceptual editorial schematics, not measured results, exact molecular structures, or photographs of HealthyWelness facilities.
Sources
- Kristensen K, Henriksen JR, Andresen TL. Adsorption of Cationic Peptides to Solid Surfaces of Glass and Plastic. PLOS ONE. 2015;10:e0122419.
- Eppendorf. Application Note 180: Evaluation of protein recovery in Protein LoBind tubes and plates.
- Hughes C, Gethings LA. Hydrophobic Peptide Recovery Improvements Using QuanRecovery Vials with MaxPeak HPS. Waters. 2019.