DLS for Peptide Aggregates: Size, Weighting and Limits
Read DLS peptide research with hydrodynamic size, intensity weighting, PDI and sample-history limits, including a hypothetical scattering calculation.


Dynamic light scattering can support an assessment of peptide-associated particles by measuring fluctuations in scattered light and relating diffusion to hydrodynamic size. A DLS size peak is not a chemical identity, aggregate mass fraction or particle count. Interpretation depends on the weighting, analysis, sample history and ability to distinguish the intended signal from other scatterers.
- DLS uses time-dependent scattering information to infer diffusion-related size.
- Hydrodynamic diameter is an equivalent-sphere description, not a direct image of a peptide chain.
- A small number of larger particles can dominate an intensity-weighted result.
- Z-average, distribution peak and polydispersity index are different outputs.
- A clean-looking size distribution does not establish chemical purity or absence of every aggregate.
Begin with the quantity the method actually observes
A DLS report is often presented as a size plot, which makes it easy to imagine the instrument counted objects with a tiny ruler. The route to that plot is different. Malvern Panalytical’s technical introduction explains the relationship among Brownian motion, fluctuations in scattered light, diffusion and hydrodynamic diameter. The reported diameter describes a sphere with an equivalent diffusion coefficient in the specified medium. Malvern Panalytical: introduction to DLS
For a peptide experiment, identify which dispersed entities could contribute: the peptide, peptide assemblies, components of the medium or extraneous particles. A size feature alone cannot assign its chemistry. An observed large-particle signal warrants investigation; it does not establish that the particles are covalent peptide dimers or even peptide-derived.
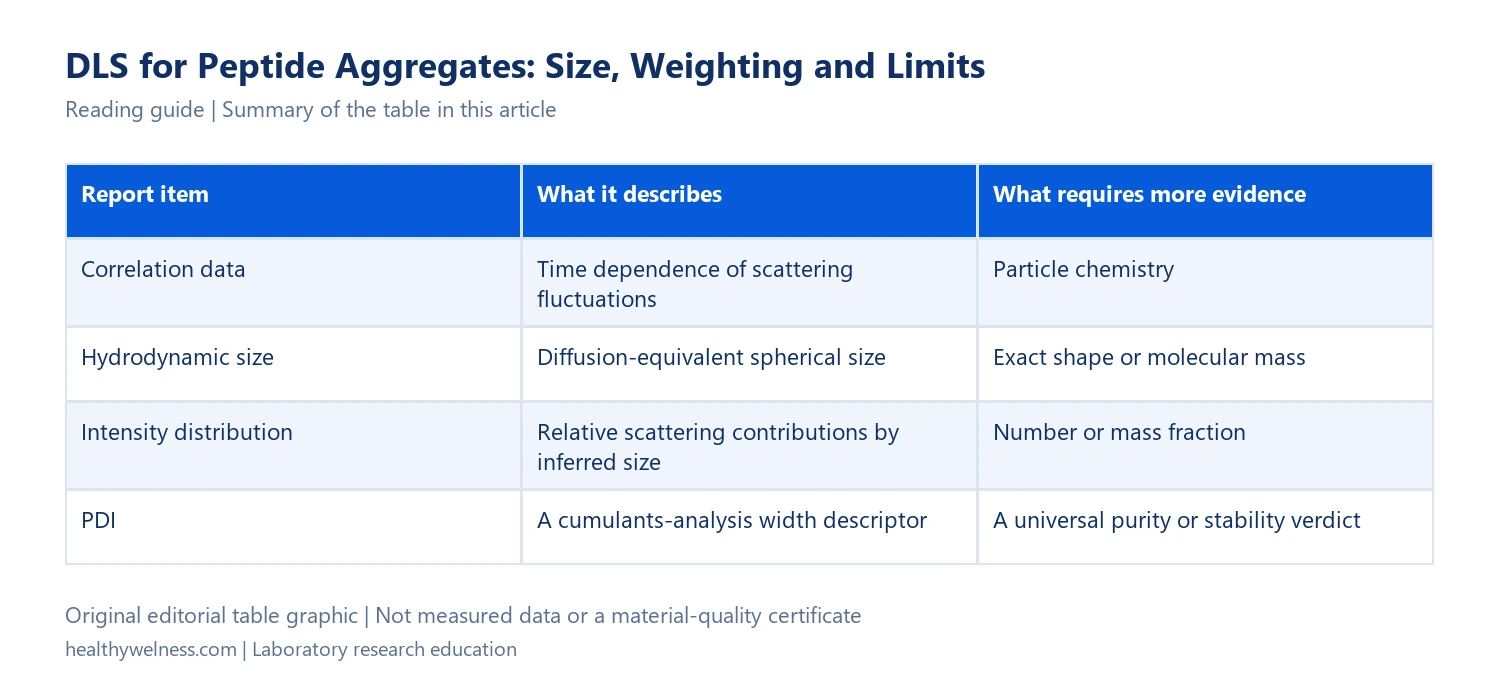
| Report item | What it describes | What requires more evidence |
|---|---|---|
| Correlation data | Time dependence of scattering fluctuations | Particle chemistry |
| Hydrodynamic size | Diffusion-equivalent spherical size | Exact shape or molecular mass |
| Intensity distribution | Relative scattering contributions by inferred size | Number or mass fraction |
| PDI | A cumulants-analysis width descriptor | A universal purity or stability verdict |
Our SEC aggregation guide addresses separation and recovery. DLS instead asks what diffusion-related information is supported by scattering from the measured dispersion. These methods can complement one another without measuring the same quantity.
The dominant intensity peak need not represent most particles
Under the Rayleigh approximation, scattered intensity from comparable spherical particles scales with the sixth power of diameter. The approximation requires particles small relative to the illumination wavelength and appropriate comparable optical conditions. It is not a universal conversion for every shape and size. The technical introduction explains this strong large-particle weighting.
Hypothetical weighting example: assume particles of diameters 5 and 25 nm, equal optical properties, independent scattering and conditions where the Rayleigh approximation is appropriate. A 25 nm particle contributes (25/5)6 = 56 = 15,625 times the intensity of one 5 nm particle in this model.
Now stipulate 100,000 small particles and ten large particles. The large-particle number fraction is 10/100,010 × 100 = approximately 0.010%. In small-particle intensity units, their respective total contributions are 100,000 and 10 × 15,625 = 156,250. The large population’s intensity fraction is therefore 156,250/256,250 × 100 = approximately 60.98%.
| Population | Count | Intensity units per particle | Total intensity units |
|---|---|---|---|
| 5 nm particles | 100,000 | 1 | 100,000 |
| 25 nm particles | 10 | 15,625 | 156,250 |
This is not a simulated measured DLS distribution or a peptide aggregation result. It isolates the weighting effect under stated assumptions. It also does not assign the ten larger particles to peptide aggregates: identity was never supplied. Reading the 60.98% intensity contribution as “60.98% of peptide molecules aggregated” would add both a counting claim and a chemical claim that the example does not establish.
Changing the distribution weighting changes the question
Malvern’s original application note on number and volume distributions demonstrates the distinction using a lysozyme–arginine mixture. Its intensity, volume and number representations emphasize different components. The named protein/amino-acid example illustrates weighting; it is not validation for every research peptide or medium. Malvern Panalytical: number and volume size distributions
Before comparing two figures, read their axes and weighting labels. An intensity distribution from one study and a transformed number distribution from another are not interchangeable evidence, even if their largest peaks appear at similar sizes. A transformed representation also retains analysis and optical assumptions; it is not an independent particle-counting experiment.
Keep the primary representation available when showing a transformed plot. If the conclusion depends on the apparent disappearance of a minor population after reweighting, explain the transformation rather than describing the material as physically changed. The sample can be identical while the plotted emphasis changes substantially.
Z-average, peak size and PDI should keep their own names
Malvern’s terminology note distinguishes the cumulants Z-average from a distribution peak and describes PDI as a dimensionless width parameter from the cumulants analysis. It identifies the Z-average as a hydrodynamic, intensity-related mean, not a mass or number average. Malvern Panalytical: common DLS terms
That vocabulary matters in a comparison table. “Size = 8 nm” is incomplete if one row means Z-average and another means the location of a fitted distribution peak. Use the actual output name and describe the analysis, rather than relabelling several statistics as the same size measurement.
A small PDI should not be turned into a universal peptide-release specification. The question is whether the descriptor and model adequately represent the measured sample for the intended comparison. A narrowly distributed contaminant could yield a neat size result while the chemistry remains wrong. Conversely, a deliberately heterogeneous research system need not be a failed preparation because it is heterogeneous.
Sample history determines which dispersion is being assessed
NIST’s batch-mode DLS protocol, revised in May 2015, addresses nanoparticle measurements in aqueous media. It discusses concentration effects, background scatterers and the need to validate preparation choices so that the analyte is not removed or changed. It is official general guidance, not a peptide-specific preparation recipe. NIST SP1200-6: batch-mode DLS
This creates a practical documentation rule for aggregate studies: record what happened before the measurement. If filtration or centrifugation removes the larger population under investigation, the final dispersion answers a question about what remained. It cannot by itself quantify all larger material in the original preparation.
Likewise, dilution can change both measurement conditions and the molecular associations being studied. A result after dilution is not automatically a readout of the undiluted sample. Note the medium, concentration, temperature, waiting history and any fraction removed, and distinguish observed changes from their proposed causes.
- What fraction of the original preparation was measured?
- Was the medium assessed for relevant scattering contributions?
- Which temperature and viscosity information entered the size interpretation?
- Were repeat measurements consistent under the defined history?
- Could a preparation step remove or alter the species of interest?
Do not choose the statistic that happens to match another method
Farkas and Kramar’s original 2021 NIST publication examines ambiguities in DLS distributions and mean values using nanoparticle samples. Its official abstract reports that inversion outputs can depend on regularization and differ from cumulant results, and warns against misleading distribution representations. The study is a metrology investigation of nanoparticles, not a universal error estimate for peptides. Farkas and Kramar, 2021
The implication is to define the measurand and analysis before deciding whether methods agree. If microscopy, SEC and DLS give different numerical sizes, first ask whether they describe the same population and property. Forcing agreement by switching from a mean to a peak, or from intensity to number weighting, can conceal the reason for the difference.
For peptide aggregates, an informative conclusion might be: “The defined dispersion showed a reproducible larger-size scattering contribution under the stated analysis.” Assigning aggregate composition, stoichiometry or mass fraction needs evidence directed at those additional claims.
Questions about DLS in peptide research
Does a large DLS peak prove peptide aggregation?
It supports the presence of a relevant scattering feature under the analysis, but chemistry and source still need assessment. Extraneous particles or medium components can also contribute.
Is intensity percentage the percentage of peptide molecules?
No. Intensity weights scatterers by their contribution to the optical signal. It is not automatically a number or mass fraction.
Does hydrodynamic diameter directly give molecular mass?
No. It describes equivalent diffusion-related size. A molecular-mass or oligomer assignment requires an appropriate additional model and evidence.
Does a low PDI prove purity?
No. A width descriptor does not establish chemical identity, concentration or absence of every unwanted species.
Can a filtered sample establish the original aggregate distribution?
Only if the preparation and sampling evidence support that claim. A measurement of the remaining fraction cannot independently account for material removed beforehand.
Connect size with the rest of the analytical record
Continue with solubility, aggregation and chemical stability, signal fractions versus material amount and the analytical-report checklist. These explanations help state what a research result supports without implying that HealthyWelness products have particular DLS data.
Cover: AI-generated conceptual editorial artwork, not an exact molecular structure, measured result or a photograph of HealthyWelness staff or facilities.