Peptide Serial Dilutions: Factors, Uncertainty and Mixing
Trace peptide research dilutions from stock to assay; compare serial and direct plans, shared uncertainty, mixing and final-volume assumptions.

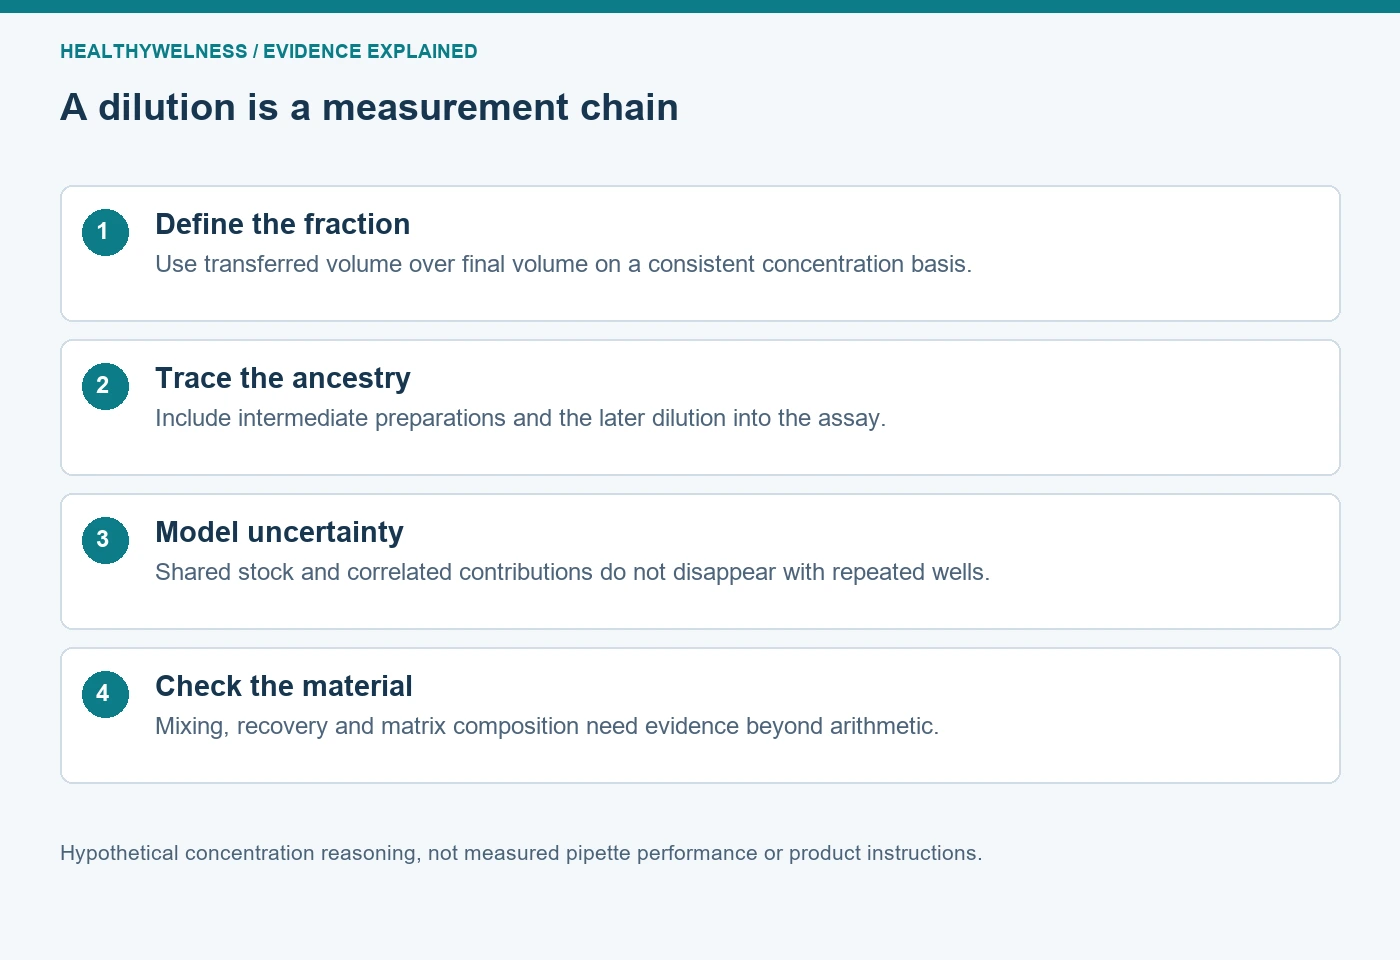
A peptide serial dilution is a chain of concentration ratios: each preparation inherits the concentration and uncertainty of its source. Multiply the actual transfer-to-final-volume fractions, include any later dilution into the assay, and distinguish uncertain ratios from shared stock errors. More steps can amplify some errors, but a direct dilution is not automatically more reliable if it requires an inadequately controlled transfer.
- A step fraction uses transferred volume divided by final volume, not necessarily transferred volume divided by added diluent.
- Serial preparations share ancestry; their errors are not automatically independent.
- Uncertainty in the starting concentration travels through the entire chain.
- Every quantity below is an invented teaching value, not a measured property of a HealthyWelness material or pipette.
Write the concentration relationship before interpreting the tube label
For a conserved analyte on a consistent concentration basis, Cnew = Csource × Vtransfer/Vfinal. The equation accounts for the amount transferred and the final solution volume. It does not, by itself, establish that the analyte dissolved completely, remained chemically unchanged or was recovered without loss.
A label such as “1:10” can be ambiguous unless its convention is stated. A one-tenth final concentration means one part source in ten parts total. One part source combined with ten parts diluent gives eleven parts total under a volume-additivity assumption, and therefore a different fraction. Record the actual volumes and the intended final-volume basis rather than relying on the label alone.
The starting concentration is another measurement input. It may be a properly assigned concentration of the relevant analyte, or merely a calculation from a powder label and added solvent. Those are not interchangeable evidence. The purity-versus-content guide explains why an integrated chromatographic percentage cannot silently become the mass fraction used in that calculation.
Follow every branch from stock to measured preparation
For n serial steps, the nominal relationship is Cn = C0 × f1 × f2 … × fn, where each f is the relevant transfer-to-final-volume fraction. A direct preparation of the same nominal target uses one overall fraction instead. Equality of the final intended fraction does not imply equality of handling performance.
Hypothetical comparison: define a stock at 80 concentration units per millilitre. Three successive fractions of one-half give 40, 20 and 10 units per millilitre. A direct fraction of one-eighth also gives 10. These quantities express concentration arithmetic only; they are not preparation recommendations for a particular peptide.
| Plan | Fractions from the original stock | Calculated concentration | Unresolved performance question |
|---|---|---|---|
| Three-step serial | 1/2 × 1/2 × 1/2 | 10 units/mL | How well is each ratio realised? |
| Direct dilution | 1/8 | 10 units/mL | How well is the direct transfer controlled? |
| Later assay dilution | Either preparation × 1/4 | 2.5 units/mL | Was this additional fraction included? |
A later transfer into assay medium is part of the chain. If the working solution supplies one-quarter of the final assay volume, the assay concentration is one-quarter of the working concentration. Naming the working tube does not establish the concentration at the detector. Conversely, removing a representative aliquot from a well-mixed solution changes the amount remaining but does not, by itself, change the concentration of what remains.
The existing peptide concentration calculator can help check units and simple relationships. A calculator cannot verify mixing, actual delivery, concentration assignment or recovery. Preserve the calculation and the experimental record as separate parts of the evidence.
Separate repeatability from the propagation of a shared deviation
Imagine that every intended serial step actually produces a fraction 2% lower than planned. This is a stipulated error in the realised concentration ratio, not an assertion that a pipette’s volume error automatically has that effect. After three steps the concentration is multiplied by 0.983 = 0.941192 relative to the plan: approximately 5.88% lower.
The distinction matters because a ratio contains more than one volume. If the transfer and final volume were both multiplied by exactly the same factor, that factor would cancel in their ratio. The concentration could remain unchanged while the prepared volume differed. If only one contributing volume changes, cancellation generally does not follow. Identify the actual measurement relationship before assigning an error to a dilution fraction.
Hanson, Ekins and Chodera’s original 2015 modelling study examines how dispensing assumptions can propagate into assay estimates. Its dilution examples distinguish imprecision from bias and consider a residual-liquid effect for a specified fixed-tip system. It is a modelling investigation, not evidence that every manual dilution has the same error or that one dispensing technology is universally superior. We use its reasoning about process structure, not its device-specific percentages. [1]
Uncertainty needs a dependence model, not just a count of transfers
NIST Technical Note 1297 describes uncertainty propagation through a measurement model, including sensitivity coefficients and covariance terms. Its first-order law is not simply an instruction to add every percentage: the way inputs enter the model and their dependence both matter. A known deviation and an uncertainty estimate answer different questions and should not be used as interchangeable labels. [2]
For a deliberately simplified multiplicative model with small, independent relative standard uncertainties, squared relative contributions can be combined. Suppose the stock’s relative standard uncertainty is 4%, and each of three realised step fractions has a relative standard uncertainty of 2%. If all four contributions are independent, the combined relative standard uncertainty is approximately √(4² + 2² + 2² + 2²)% = 5.29%.
That result is conditional. If the three step-fraction contributions are perfectly positively correlated with one another, while independent of the stock contribution, their first-order combined contribution is 6%, not √12%. The combined result becomes √(4² + 6²)% = 7.21%. These are hypothetical standard uncertainties, not confidence limits or empirical specifications.
| Case | Assumptions | Approximate relative standard uncertainty |
|---|---|---|
| Serial, independent steps | 4% stock; three independent 2% fractions | 5.29% |
| Serial, shared step contribution | 4% stock; three perfectly correlated 2% fractions | 7.21% |
| Direct, one less-controlled fraction | 4% stock; independent 6% direct fraction | 7.21% |
The direct case shows why “fewer steps” is not a complete decision rule. A much smaller required transfer might carry a larger uncertainty than several better-controlled ratios. The appropriate comparison uses the relevant performance at the actual volumes and conditions. The numbers in this table were chosen to illustrate that comparison, not to rank any real instrument or preparation method.
Shared ancestry also links the points in a concentration series
If several points descend from the same intermediate solution, uncertainty in that intermediate contributes to all of them. Repeating the final assay well does not create an independently assigned concentration. Nor does a smooth response curve prove that every concentration on its horizontal axis was correct.
The calibration and reference-standard guide already explains how a shared stock mistake can coexist with a straight calibration line. Here the additional decision is how the preparation tree generates dependence. A useful diagram identifies which points share a stock, an intermediate, a delivery operation or a preparation run.
Independent preparations can help investigate repeatability at the preparation level. They do not automatically remove a shared wrong stock assignment or a common calibration problem. Describe what was independently prepared and what remained shared before interpreting agreement between curves.
Mixing, solution history and final matrix stay outside pure arithmetic
The concentration equations assume that the transferred portion represents its source solution. Incomplete mixing can defeat that assumption. Surface loss, precipitation or a chemical change can also make the conserved-analyte model inappropriate. A correct spreadsheet does not establish that the relevant material actually reached the next preparation.
Eppendorf’s first-party small-volume guidance identifies low-volume handling, tool selection, calibration and technique as important to accuracy and precision. It also notes that preparing a dilution can permit larger transfers. This supports examining the actual liquid-handling situation; it is not a peptide-specific recovery study or a guarantee that a larger volume solves every problem. [3]
The final matrix can change along with concentration. If a stock carries a solvent or buffer component and successive steps use a different diluent, that component is diluted too. Matching nominal peptide concentration does not ensure matching solvent composition. Conversely, matching the solvent fraction does not demonstrate equal peptide recovery. Keep these questions separate and use controls appropriate to the assay.
Record source identity and assigned concentration, transfer and final volumes, cumulative fractions, preparation ancestry, mixing and handling conditions, and any later assay dilution. If a loss or deviation is measured, preserve that observation and its measurement basis instead of relabelling the nominal concentration as a verified one. The accuracy and precision guide helps distinguish the performance terms used in such a record.
Frequently asked questions
Is a serial dilution always less accurate than a direct dilution?
No. The comparison depends on the realised fractions, relevant volume performance, shared deviations and handling. A direct dilution requiring a poorly controlled small transfer can be less reliable than a justified intermediate preparation.
Does taking an aliquot dilute the solution left in the tube?
Not merely by removing a representative aliquot from a homogeneous solution. The amount and volume remaining decrease together. Additional solvent, evaporation or selective loss would introduce different changes.
Can I add percentage uncertainties directly?
Not as a universal rule. State whether the quantities are errors, standard uncertainties or limits, identify the measurement model and account for dependence. The examples here use explicit first-order assumptions.
Does a good curve fit verify the dilution concentrations?
No. A response model can fit smoothly while the assigned concentrations share a mistake. Independent information about the preparation and concentration basis is needed.
Are the calculated concentrations in this guide product instructions?
No. They are invented laboratory arithmetic examples. They establish no formulation, handling suitability, recovery or use instructions for a particular material.
Sources and reading scope
- Hanson SM, Ekins S, Chodera JD. Modeling error in experimental assays using the bootstrap principle. J Comput Aided Mol Des. 2015;29:1073–1086. DOI 10.1007/s10822-015-9888-6. Original abstract, dilution-model sections and fixed-tip dilution-effect discussion read; supplementary notebook not evaluated.
- NIST. Technical Note 1297, 1994 edition, Appendix A. Original measurement-model and uncertainty-propagation text read. This article’s numerical examples are independently constructed applications with stated assumptions.
- Eppendorf. How to Pipette Small Volumes with Handheld Manual Pipettes. First-party technical page; relevant complete article text read, not a peptide-specific validation.
Cover and evidence map: original conceptual editorial schematics, not measured results, exact molecular structures, or photographs of HealthyWelness facilities.