Peptide Enzyme Kinetics: Km, Kd and Turnover Explained
Distinguish peptide-substrate Km from binding Kd, interpret turnover and initial rates, and examine the assumptions behind enzyme-kinetic comparisons.


An enzyme’s Michaelis constant, Km, is generally not the equilibrium dissociation constant, Kd, for its peptide substrate. Km describes a substrate-dependent reaction-rate curve; Kd describes a specified binding equilibrium. They approach one another only under additional mechanistic assumptions. Neither number alone measures how long a research peptide remains intact in a complex sample.
- The Michaelis constant has concentration units and equals the substrate concentration at half the limiting rate for a Michaelis–Menten curve; IUBMB terminology does not generally define it as an equilibrium constant.
- For the explicitly simplified scheme E + S ⇌ ES → E + P, the steady-state expression is Km = (koff + kcat)/kon, whereas the ES binding dissociation constant is koff/kon.
- The numerical examples below are invented teaching calculations, not measurements of any HealthyWelness material, commercial batch or named protease.
Why does a peptide substrate require a different question from a ligand?
A peptide can bind a protein without being consumed, or it can be a substrate that the protein chemically transforms. Those are different experimental questions. If the question is how much enzyme–peptide complex exists at equilibrium, a binding experiment and an equilibrium model are relevant. If the question is how rapidly the enzyme converts the peptide into products, a reaction-rate experiment is relevant. Replacing one question with the other can make a plausible-looking comparison scientifically misleading.
In its nomenclature recommendations, IUBMB defines a substrate as a reactant in a catalysed reaction and deliberately separates observed quantities from assumptions about mechanism. That distinction is useful when a paper uses the word “affinity” informally: first identify whether its observations are bound fractions, reaction rates or remaining intact material. Those measurements need not rank a set of peptides in the same order. IUBMB: definitions and rate constants.
Which quantity answers which question?
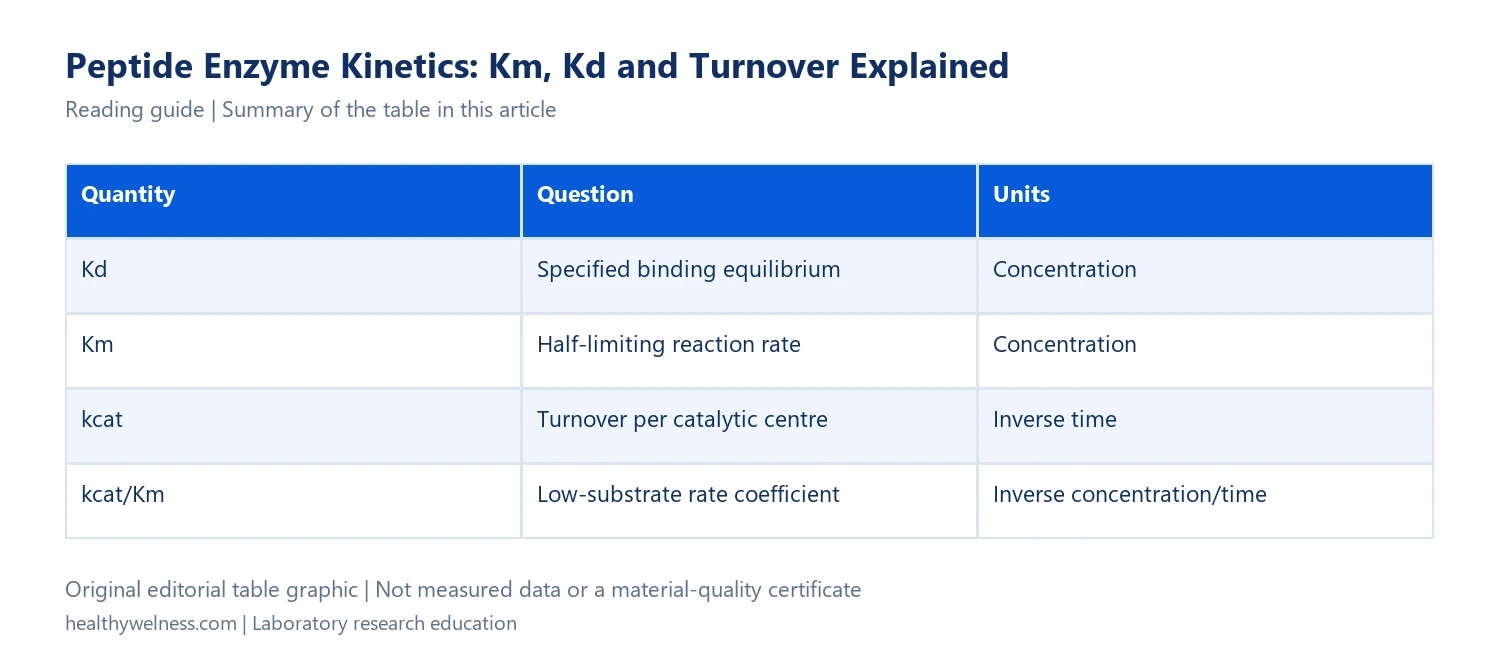
| Quantity | Question | Units |
|---|---|---|
| Kd | Specified binding equilibrium | Concentration |
| Km | Half-limiting reaction rate | Concentration |
| kcat | Turnover per catalytic centre | Inverse time |
| kcat/Km | Low-substrate rate coefficient | Inverse concentration/time |
IUBMB’s operational definition matters here: the same hyperbolic rate equation can arise from different mechanisms. A successful curve fit therefore does not establish a unique sequence of molecular steps. The particular formula involving three elementary constants applies to the stated simple model, not to every enzyme reaction. Multi-substrate reactions and substrate inhibition require additional interpretation. IUBMB: Michaelis–Menten kinetics and its limits.
For a research record, write “apparent Km under these conditions” when that is the quantity actually estimated. Include the peptide sequence and any reporter groups. A short fluorescent substrate and its unlabelled parent peptide are separate test materials, even when they share a cleavage motif.
How can Km change when binding Kd does not?
Consider an invented single-step binding/turnover model, with association constant kon = 1,000,000 M−1s−1 and dissociation constant koff = 1 s−1. The ES binding equilibrium gives Kd = 1/1,000,000 M = 1 µM. Now imagine two otherwise simplified cases that differ only in the catalytic conversion step.
Case A has kcat = 0.01 s−1. Its Km is (1 + 0.01)/1,000,000 M = 1.01 µM. Case B has kcat = 9 s−1. Its Km is 10/1,000,000 M = 10 µM. Binding Kd remains 1 µM in both invented cases. The larger Km in B does not, by itself, demonstrate weaker equilibrium binding. It reflects the additional route by which ES disappears into product in this model.
These numbers make the limiting assumption visible. When catalytic conversion is much slower than dissociation, adding kcat scarcely changes the numerator, so Km approaches Kd. When conversion is comparable to or faster than dissociation, that approximation fails. The example is an algebraic counterexample to equating the constants, not a claim that any particular protease has these rate constants.
There is another useful consequence. Two preparations with the same binding equilibrium may process substrate at very different rates. Conversely, a measured reaction curve may look similar even when more than one microscopic constant differs. A fit to rate data cannot recover every hidden elementary constant simply because its two fitted parameters are precise.
What does a substrate–rate curve actually show?
For a hypothetical system following v = Vmax[S]/(Km + [S]), let Vmax be 100 nM product per second and Km be 10 µM. At substrate concentrations of 1, 10 and 100 µM, the model predicts rates of approximately 9.09, 50 and 90.91 nM/s. These are calculations from chosen parameters, not fitted observations.
The three calculations also explain why one substrate concentration is insufficient. A rate of 50 nM/s could be half of a 100 nM/s limiting rate, but it could also arise from another parameter combination. Without observations spanning an informative substrate range and an adequate model, the limiting rate and Km may trade off against one another.
GraphPad’s technical guide distinguishes the early transient, the approximately linear product-accumulation interval and the later plateau. A reaction endpoint is not automatically an initial rate. In particular, an endpoint after substantial depletion mixes changing substrate concentration with elapsed reaction time. Dividing that endpoint by time does not restore the missing initial-rate information. GraphPad: enzyme progress curves and terminology.
As a separate hypothetical example, suppose product rises by 30 nM in a 10-second interval and by only 12 nM in the following 10 seconds. The interval-average rates are 3 and 1.2 nM/s. Combining them gives 2.1 nM/s across 20 seconds; it does not show that the enzyme had a constant rate of 2.1 nM/s. Plotting the individual time points preserves the information needed to question that interpretation.
Why do enzyme concentration and detection calibration matter?
The NIH-hosted Assay Guidance Manual discusses progress curves, instrument linearity and substrate choice as parts of enzymatic-assay development. These checks distinguish chemical conversion from the signal used to observe it. The guidance includes peptide surrogate substrates, but does not validate every labelled peptide assay. Brooks and colleagues: Basics of Enzymatic Assays for HTS.
To see the concentration issue algebraically, assume one active catalytic centre per enzyme molecule and kcat = 2 s−1. With 5 nM active enzyme, Vmax would be 10 nM/s; with 10 nM active enzyme, it would be 20 nM/s. The limiting rate doubled without any assumed change in the intrinsic turnover constant. Reporting the two rates as different “substrate strengths” would confuse enzyme amount with the quantity being compared.
Now suppose a nominal 10 nM preparation contains only 5 nM active centres. Dividing a measured Vmax of 10 nM/s by the nominal concentration gives 1 s−1; dividing by the stipulated active-centre concentration gives 2 s−1. This invented example shows why the basis of enzyme concentration belongs in the record. It does not supply an activity correction for real material.
What should accompany a peptide-enzyme result?
A useful methods description connects the enzyme construct, peptide identity, reaction conditions, product readout, time interval and fitted model. Identify what was held constant and what was varied. Preserve the rate units, the basis of concentration, replicate structure, parameter uncertainty and fit residuals. If an assay depends on a second substrate or cofactor, include its conditions rather than treating the fitted value as an unconditional molecular property.
For comparing two published experiments, make a small reconciliation sheet before comparing their headline values. If one measures a labelled cleavage product and another measures loss of intact peptide, explain how each observation is connected to the proposed reaction. If that connection is unavailable, describe the values as different operational measurements. The spreadsheet cannot create comparability that the methods did not establish.
What are the important interpretation limits?
A lower Km is not a general declaration that a peptide is “better.” Better requires a defined question: initial rate at a specified substrate concentration, equilibrium occupancy, analytical sensitivity or some other outcome. Similarly, disappearance of a parent peak in a complex mixture does not by itself identify the responsible enzyme or cleavage site. That question needs product evidence and controls.
Do not convert Km into a peptide half-life. Even the simple model requires enzyme amount and substrate concentration to predict a rate, and a complex sample introduces additional reactions and losses. Laboratory kinetic parameters are not recommendations for human or veterinary use.
Frequently asked questions
Is Km a binding-affinity constant?
Km is a reaction-rate parameter. It can approximate a substrate binding dissociation constant under a suitably justified rapid-equilibrium limit of a specified mechanism, but the approximation should not be assumed merely because both have concentration units.
Does the smallest Km identify the fastest-cleaved peptide?
Not necessarily. Reaction rate also depends on the limiting rate, substrate concentration and model. A comparison should identify the enzyme amount, active-centre basis and experimental conditions rather than ranking peptides by one parameter.
Can an endpoint fluorescence value determine Km?
One endpoint alone cannot identify both Km and the limiting rate. A substrate-dependent series may support a fit only when the endpoint readout reliably represents the relevant rate interval and the assay model is appropriate.
Is kcat divided by Km the same as Kd?
No. The quantities have different dimensions. kcat/Km has inverse concentration per time units and describes the low-substrate rate coefficient within the relevant kinetic model; Kd has concentration units.
Do enzyme kinetics establish commercial peptide quality?
An enzyme experiment answers a defined functional question under stated conditions. It does not replace identity, content, impurity and other material-specific evidence, and the hypothetical calculations in this guide are not commercial-batch test results.
Scope and related reading
This guide interprets laboratory reaction-rate measurements. It does not report new experiments or establish material-specific stability. For connected questions, read binding affinity versus potency, fluorescence interference, calibration curves and reference standards, and peptide cleavage-site mapping.
Cover: AI-generated conceptual editorial artwork, not an exact molecular structure, measured result or a photograph of HealthyWelness staff or facilities.