Hill Slope in Peptide Assays: Shape vs Cooperativity
Interpret Hill slope in peptide research: curve steepness, model constraints and why a fitted slope alone cannot establish molecular cooperativity.

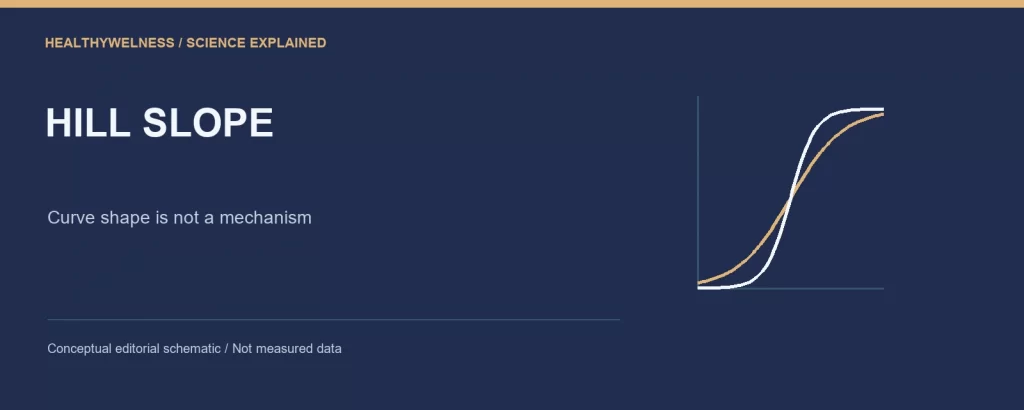
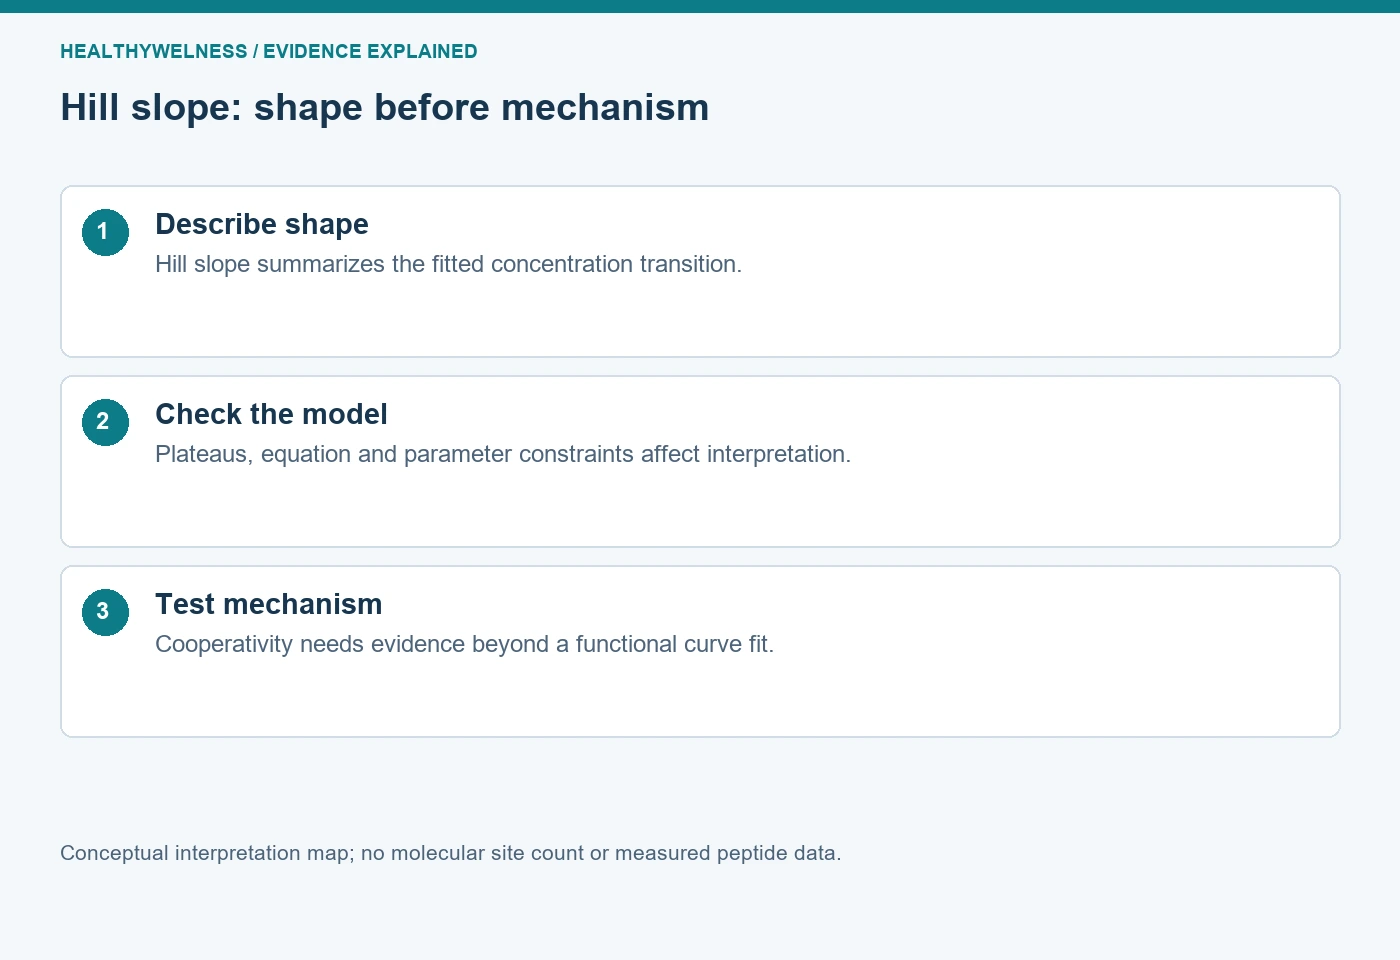
A Hill slope describes the steepness of a fitted concentration–response curve; it does not by itself establish molecular cooperativity or count binding sites. In a peptide assay, the observed shape combines the test system, measurement process and fitted model. A steep or shallow curve is a reason to investigate those components before assigning a molecular mechanism.
- The Hill slope is dimensionless and describes curve shape under a specified equation.
- Midpoint, response span and steepness are separate fitted properties.
- A functional response curve is not necessarily a direct measurement of binding-site occupancy.
- All numerical curves below are hypothetical calculations, not measurements of research materials.
What changes when only the Hill slope changes?
Consider the increasing-response equation R = B + (T − B)Ch/(Mh + Ch). Here C is concentration, B and T are the bottom and top plateaus, M is the halfway concentration and h is the slope parameter. At C = M, the response is halfway between B and T whatever positive value h takes. Changing h therefore need not move the midpoint or change either plateau.
GraphPad’s first-party description of the four-parameter logistic equation identifies these parameters separately and defines Hill slope as a unitless steepness parameter. The equation is an empirical description: fitting it does not mean every parameter corresponds to one elementary molecular event. That distinction is particularly useful for downstream cell-based peptide responses. [1]
| Concentration/M | h = 0.5 | h = 1 | h = 2 |
|---|---|---|---|
| 0.1 | 24.0% | 9.1% | 1.0% |
| 1 | 50.0% | 50.0% | 50.0% |
| 10 | 76.0% | 90.9% | 99.0% |
The percentages use B = 0 and T = 100. They describe the stipulated model, not a universal response to a tenfold concentration change. The shallow curve responds across a broader concentration range; the steep curve changes more abruptly around its midpoint. Calling the steep curve “stronger binding” adds an interpretation absent from this calculation.
Why is a logarithmic concentration axis important?
The visual impression of steepness depends on the horizontal scale. A standard saturating curve looks hyperbolic against linear concentration and sigmoid against logarithmic concentration. A curve becoming S-shaped after changing the axis is not evidence that binding sites suddenly interact. The Hill parameter belongs to the equation and scale convention, not to an unaided judgement about the picture.
Within the positive-h equation above, the ratio of concentrations giving 90% and 10% of the response span is 811/h. It is 81 when h = 1, nine when h = 2, and 6,561 when h = 0.5. This is derived by solving the same equation at fractions 0.9 and 0.1. It makes “steepness” concrete: a narrower concentration interval covers the central response span.
GraphPad’s Hill-slope guide uses the 81-fold interval for a standard curve and distinguishes positive slopes for increasing curves from negative slopes for decreasing curves in its convention. Software packages can express inhibitory curves differently. Before comparing reported values, check the exact equation and whether the author reports a signed parameter or its magnitude. A negative fitted slope in a descending inhibition equation does not mean negative cooperativity. [2]
Cooperativity is a mechanistic claim about interactions
Molecular binding cooperativity concerns how one binding event changes subsequent binding within a specified interacting system. A Hill slope can summarize the resulting binding curve, but a downstream concentration–response assay observes a different quantity. Receptor occupancy can be transformed by signal generation, regulation, degradation and the detector before the response reaches the plotted axis.
In the restricted context of an allosteric substrate–velocity model, GraphPad describes an empirical sigmoidal equation and explicitly cautions that the Hill parameter does not always equal the number of interacting sites. That restricted model should not be generalized into a rule that a cellular slope of two proves a receptor dimer, or that a slope near one excludes every possible interaction. [3]
There are two distinct inferential steps: whether the measured curve reliably differs from a reference shape, and whether a particular mechanism explains that difference. Precise estimation of h can strengthen the first step without resolving the second. Additional binding, structural or perturbation evidence is needed when the claim specifically concerns interactions between molecular sites.
- Descriptive claim: this dataset supports a narrower concentration transition under this fitted model.
- Mechanistic hypothesis: interacting binding events contribute to that transition.
- Required bridge: experiments that distinguish the proposed interaction from alternative explanations.
A concentration series can hide more than one process
A peptide experiment can contain heterogeneous receptor states, different responding cell populations or more than one signal-generating pathway. A single sigmoid may then summarize a composite rather than one homogeneous interaction. The useful question is whether the single-curve model represents the observations adequately, not whether it produces a convenient slope.
Detector saturation can also compress the upper response range. A concentration-dependent optical artifact can alter the apparent transition. These possibilities should be tested through suitable detection controls and other measurements; they should not be diagnosed from the slope alone. The existing fluorescence interference guide develops that separate evidence question.
Time is another hidden component. If higher concentrations produce earlier peaks and the experiment records one fixed endpoint, the plotted concentration series may combine different phases of the response. Hoare and colleagues’ GPCR kinetic-analysis research demonstrates the importance of rise, decline and sustained-response profiles. It supports keeping timing visible; it does not identify the cause of an unusual slope in an unrelated peptide assay. [4]
When does a fitted slope deserve confidence?
The most informative data for steepness surround the transition, while observations near both plateaus help distinguish steepness from response-span choices. If the series samples only the lower rising region, several combinations of top, midpoint and slope can fit similarly. A clean fitted line cannot supply the missing plateau observations.
Fixing the top and bottom to chosen values can make the slope appear more stable, but that stability depends on the constraints. Constraining an unsupported top to 100% may force the slope and midpoint to accommodate an assumption rather than the data. Report which parameters were estimated and which were fixed, with the basis for each constraint.
Inspect residuals, parameter uncertainty and repeat experiments as well as the displayed curve. A few clustered observations in a narrow region do not become an informative concentration series merely because each was measured many times. More technical precision at the same concentrations answers a different problem from broader coverage of the curve.
GraphPad discusses choosing between standard- and variable-slope equations as a modelling decision. Its suggestions are not a universal minimum number of observations. The appropriate decision depends on concentration coverage, noise, constraints and scientific purpose. The slope should not be freed only when it makes the preferred comparison look more convincing.
Keep shape and mechanism separate in the research record
A useful record includes the peptide’s complete identity, biological system, readout, exposure interval, concentration units, equation, plateau constraints, slope convention and parameter uncertainty. Preserve raw observations so that normalization and exclusion choices remain inspectable. Report an unusual slope as an observation before proposing why it occurred.
For example, “the fitted increasing curve had h greater than one under the stated assay conditions” is narrower than “the peptide binds cooperatively.” A mechanistic discussion can follow, but should identify the evidence supporting that additional step. Conversely, h close to one does not make material identity, selectivity or detector behavior self-validating.
Material documentation remains a separate layer. The COA lookup provides a route to available analytical documentation; a certificate is not evidence for a Hill mechanism, and a functional fit does not replace analytical identification. This article reports no commercial-batch measurements.
Frequently asked questions
Does a Hill slope of two mean two binding sites?
No. A slope of two in a functional curve is an empirical shape estimate. Inferring site number requires a justified molecular model and independent evidence; the fitted number is not a direct site count.
Can two curves share an EC50 but have different slopes?
Yes. In the four-parameter equation, midpoint and slope are distinct parameters. The hypothetical table shows three curves sharing the same midpoint and plateaus but differing across the surrounding concentration range.
Does a negative Hill slope indicate negative cooperativity?
Not automatically. Some software uses a negative sign for a descending response curve. Read the equation and sign convention before attaching a mechanistic interpretation.
Should the slope always be fixed to one?
No universal rule applies. A fixed slope is a model constraint that needs justification. A variable slope also needs sufficiently informative observations and transparent uncertainty reporting.
Does a steep curve prove selectivity?
No. Selectivity concerns responses or binding across specified targets or systems. Steepness within one assay does not provide those comparisons.
Related interpretation questions
Read binding affinity versus potency for the meaning of midpoint quantities, and controls and replicates for comparisons that test alternative explanations.
References
- GraphPad Software. Equation: Sigmoidal dose-response (variable slope). Technical guide.
- GraphPad Software. Hill slope. Technical guide.
- GraphPad Software. Equation: Allosteric sigmoidal. Technical guide.
- Hoare SRJ, et al. Analyzing kinetic signaling data for G-protein-coupled receptors. Scientific Reports. 2020;10:12263. PMID: 32704081. Original research.
Cover and evidence map: original conceptual editorial schematics, not measured results, exact molecular structures, or photographs of HealthyWelness facilities.