Peptide Evaporation: Concentration Drift in Assays
Understand how solvent loss changes peptide research concentrations, why plate position matters, and how amount loss can hide behind an unchanged value.

Evaporation can increase peptide concentration while the amount of intact peptide stays unchanged or decreases. Interpret concentration as target amount divided by current solution volume, and investigate solvent loss separately from adsorption, degradation and assay response. A higher concentration after holding is not evidence of improved recovery, and a plate-edge signal is not proof of evaporation.
- Concentration and amount have different denominators; solvent loss can change one without changing the other.
- Volume loss also changes concentrations of retained medium components.
- Microplate position can be associated with evaporation, temperature or measurement effects.
- The numerical examples are invented and do not predict evaporation from any named container.
Follow the denominator as well as the peptide
A research solution is assigned a starting concentration, held during an experiment and measured later. The later signal is larger. One tempting explanation is that more peptide became detectable or that the preparation remained exceptionally stable. Another is simpler: less solvent remains. Before interpreting a response as chemistry or biology, ask whether the volume used in the original concentration calculation still describes the sampled preparation.
For the same defined target, C = n/V, where n is amount and V is current solution volume. Comparing two times gives C1/C0 = (n1/n0) × (V0/V1). This relationship is arithmetic, not a kinetic model. It requires comparable quantity definitions and a representative liquid sample. It does not establish where missing target went.
If a fraction f of the initial volume is lost while target amount remains unchanged, the concentration factor is 1/(1−f). A 10% volume loss therefore gives approximately 11.1% higher concentration, rather than exactly 10% higher concentration. The denominator shrank from one to 0.9. No extra target was created.
| Volume remaining | Target remaining | Concentration factor | Concentration change |
|---|---|---|---|
| 100% | 100% | 1.000 | 0% |
| 95% | 100% | 1.053 | +5.3% |
| 90% | 100% | 1.111 | +11.1% |
| 80% | 100% | 1.250 | +25.0% |
Small-volume evidence needs the actual geometry and environment
Berthier and colleagues’ 2008 paper addresses evaporation in microscale assays and presents a dimensionless evaporation number for characterizing volume loss. The abstract explicitly connects evaporation with concentration and osmolarity concerns across assay types. This article relies on that verified abstract; access to the full-text repository was blocked during preparation, so no apparatus-specific evaporation rate or detailed model parameter is adopted. [1]
A universal percentage per hour would hide the variables that make the problem experimental. Exposed surface, fill volume, cover design, humidity, temperature and air movement belong in the observation record. A rate measured in one geometry cannot simply be pasted into another because both are called microplates or tubes. Even the same plate format may experience different histories during dispensing, waiting and reading.
Distinguish an open handling interval from a covered incubation interval. A cover applied after preparation does not erase earlier solvent loss. Conversely, a short uncovered interval does not automatically establish a material change large enough to affect the result. Measure or bound the relevant change instead of converting every mention of evaporation into a conclusion.
A plate-edge pattern identifies a location problem before a mechanism
The NIH Assay Guidance Manual’s microplate chapter identifies evaporation as one source of edge effects, while also describing thermal, manufacturing, dispensing and reader contributions to positional bias. It notes that functional signal direction is assay-dependent. An edge can therefore appear high in one readout and low in another without contradiction. [2]
The manual’s assay-validation chapter likewise distinguishes evaporation-related edge effects from thermal equilibration differences. This prevents an attractive shortcut: recognizing a perimeter pattern is useful troubleshooting evidence, but it does not measure solvent loss or exclude other causes. The chapters concern general assay development; neither reports evaporation measurements for a HealthyWelness peptide preparation. [3]
A useful investigation can compare uniform preparations across positions and preserve the layout, orientation and timing. If concentrations are arranged systematically from one side to the other, position and intended concentration may be entangled. A fitted concentration-response curve can then absorb a handling pattern as though it were an intrinsic response property.
- Record plate type, working volume and cover configuration.
- Preserve preparation, incubation and read order with elapsed times.
- Plot controls by position before averaging them together.
- Measure a relevant volume or mass change when evaporation is the proposed explanation.
- Keep temperature and detection alternatives in the interpretation.
An invented example shows why unchanged concentration can conceal target loss
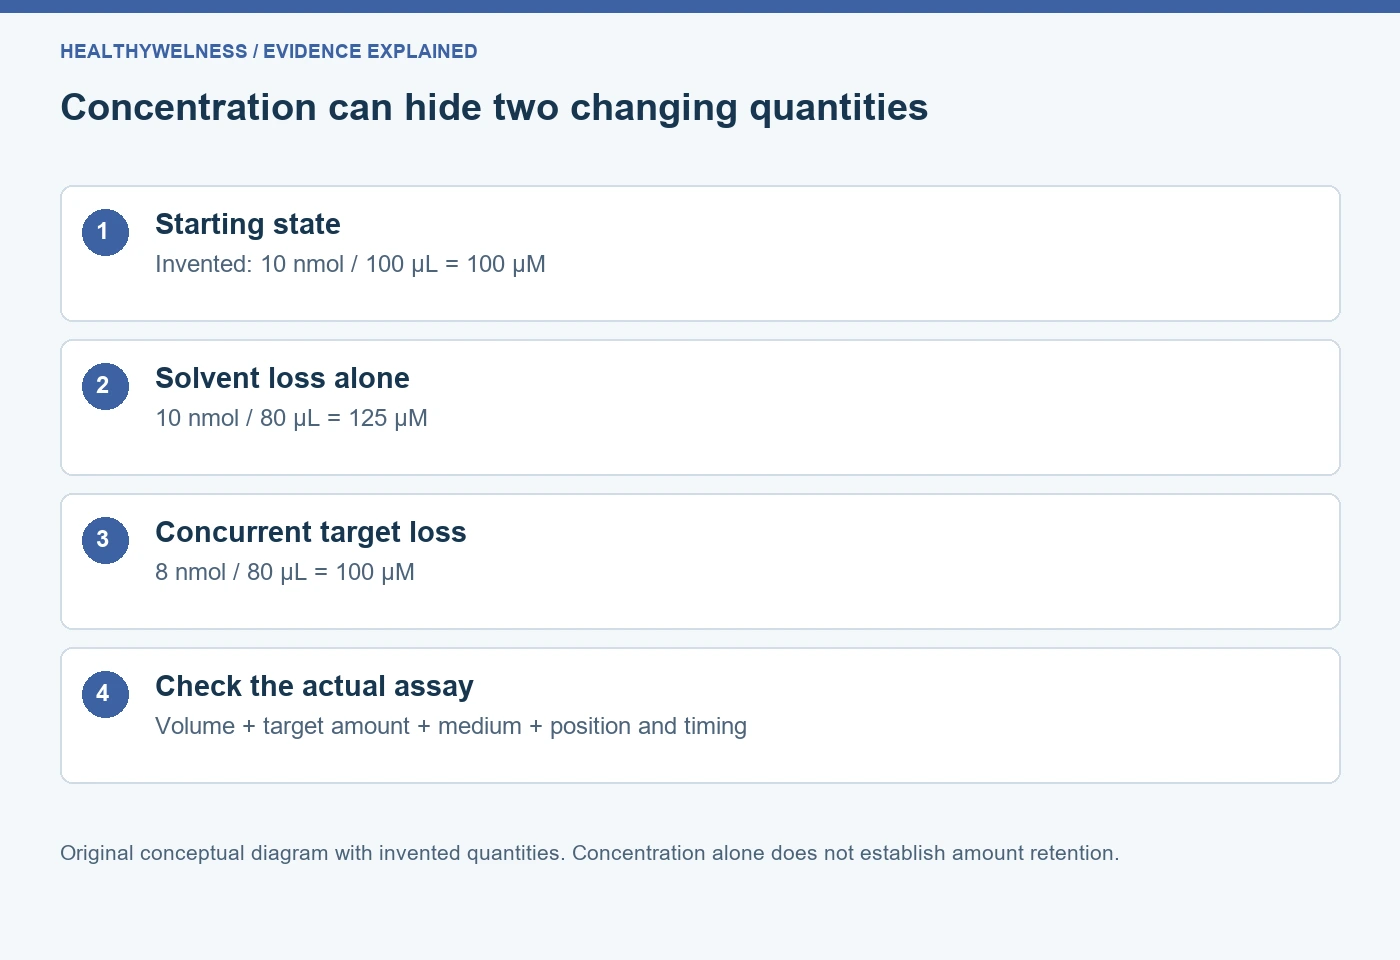
Hypothetical worked example: each preparation starts with 10 nmol of intact target in 100 µL, corresponding to 100 µM. Assume that target amount and final volume can be independently established by suitable methods. Preparation A ends with 10 nmol in 80 µL. Preparation B ends with 8 nmol in 80 µL. No quantities describe real product behaviour.
A has a final concentration of 125 µM: target amount is fully retained but concentration rose by 25%. B has a final concentration of 100 µM: target amount fell by 20%, exactly offset by the 20% volume decrease. Reporting that B’s concentration stayed unchanged would be true, but reporting that B retained all target would be false under these stipulated measurements.
| Preparation | Final intact target | Final volume | Final concentration |
|---|---|---|---|
| Starting state | 10 nmol | 100 µL | 100 µM |
| A | 10 nmol | 80 µL | 125 µM |
| B | 8 nmol | 80 µL | 100 µM |
The calculation does not determine why B lost target. Adsorption, chemical change, unrecovered material and measurement limitations remain candidates. It shows why an endpoint concentration alone cannot discriminate among these histories. If the amount measurement merely multiplied measured concentration by the assumed original volume, it would not be independent evidence and would reproduce the original denominator mistake.
A third case makes the competing changes clearer. If 9 nmol remains in 80 µL, concentration becomes 112.5 µM despite a 10% loss of intact amount. The direction of a concentration change cannot, by itself, determine the direction of target-amount change. Preserve both quantities when the stability question requires both.
The rest of the medium changes with the solvent
If a nonvolatile dissolved component remains in the same amount while volume falls, its concentration rises too. The experiment is not simply delivering a higher peptide concentration into an otherwise fixed environment. Buffer constituents, salts and retained additives may also change, and their consequences can differ across detection systems.
Do not infer pH from a volume ratio alone. The actual equilibrium and composition determine pH, and volatile components or gas exchange can complicate the system. A mass–volume equation is insufficient to calculate all properties of an evolving mixture. A nominally unchanged pH reading also does not establish unchanged ionic composition or target concentration.
Mixed solvents create another boundary. Preferential evaporation can change composition, so adding a guessed volume of water does not necessarily reconstruct the starting medium. Even perfect volume restoration would not reverse chemical change or recover target from a wall. A restoration experiment answers its own question and should retain its preparation history.
Measure volume loss without claiming more than the measurement supports
A change in total vessel mass can support solvent-loss assessment when other mass exchanges and handling contributions are addressed. Converting that mass change to volume needs an appropriate density assumption. A whole-plate measurement averages across wells and cannot independently establish which individual wells lost liquid. A matched surrogate can be useful, but its relevance to the actual sample needs justification.
Likewise, an optical volume indicator requires calibration and compatibility. If peptide, medium or optical geometry changes its response, it may not provide an independent volume estimate. A useful record separates what was measured directly, what was calculated and what was assumed. Numerical precision in a spreadsheet cannot compensate for an unsupported density or response model.
The peptide concentration calculator can check mass–volume arithmetic once the relevant quantities are known. It does not measure residual volume or account for changing solvent composition. Keep the original preparation calculation and the later volume evidence as distinct records.
Read a corrected concentration as a new estimate with limits
A correction based on measured remaining volume can improve the concentration estimate, but it does not recreate the exposure history. If an assay operated while concentration was drifting, the endpoint concentration does not describe every earlier moment. A time-dependent response may therefore need the handling timeline as well as the endpoint correction.
For the surrounding distinctions, read serial dilution and uncertainty, adsorption and recovery, and randomization and blinding. The present question concerns solvent loss after preparation, rather than propagation through a planned dilution or association with a surface.
Frequently asked questions
Does evaporation always increase peptide concentration?
It increases concentration if the relevant target amount is retained while volume decreases. Concurrent target loss can reduce, cancel or outweigh that increase. Both numerator and denominator must be considered.
Does a higher analytical signal prove more intact peptide remains?
No. Concentration, matrix effects and detection behaviour can change signal without increasing total intact amount. A suitable quantitative method and volume evidence are needed for that conclusion.
Are plate-edge effects always caused by evaporation?
No. Temperature, dispensing, plate properties and reader behaviour can also create positional differences. The pattern locates a potential problem before it identifies the mechanism.
Can adding water restore the original sample?
Volume restoration alone does not reverse chemical change, surface loss or altered mixed-solvent composition. The resulting preparation has a new history that must be evaluated for the intended assay.
Can the original concentration label remain valid throughout incubation?
Only if evidence supports the assumptions required over that interval. A starting label records preparation intent; it does not measure later volume, intact amount or composition.
References
- Berthier E, et al. Managing evaporation for more robust microscale assays. Part 1. Volume loss in high throughput assays. Lab Chip. 2008;8(6):852–859. PMID: 18497901.
- Assay Guidance Manual. Microplate Selection and Recommended Practices in High-throughput Screening and Quantitative Biology. Positional effects section.
- Assay Guidance Manual. HTS Assay Validation. Section 3.2.3.3: Edge Effects.
Cover and evidence map: original conceptual editorial schematics, not measured results, exact molecular structures, or photographs of HealthyWelness facilities.
Sources
- Berthier E, et al. Managing evaporation for more robust microscale assays. Part 1. Volume loss in high throughput assays. Lab Chip. 2008;8(6):852–859. PMID: 18497901.
- Assay Guidance Manual. Microplate Selection and Recommended Practices in High-throughput Screening and Quantitative Biology. Positional effects section.
- Assay Guidance Manual. HTS Assay Validation. Section 3.2.3.3: Edge Effects.