Enzyme Inhibition: Substrate Dependence and Mechanism
Interpret peptide-substrate inhibition data by separating kinetic models, substrate-dependent IC50 shifts, binding-site claims and assay limitations.


An enzyme-inhibition curve at one peptide-substrate concentration cannot establish a unique inhibition mechanism. Competitive, uncompetitive and mixed models predict different changes as substrate varies, while a reported IC50 also depends on the assay conditions. Interpret a substrate–inhibitor matrix, its controls and model limitations before assigning a binding mechanism or converting an IC50 into a Ki.
For laboratory research use only. This guide interprets biochemical measurements; it provides no human or veterinary use instructions and reports no measurements of HealthyWelness products.
- State which substrate the mechanism refers to, particularly for enzymes requiring two substrates.
- A kinetic competition pattern is not a direct image of a binding pocket.
- IC50 shifts can occur without changing the inhibitor’s stipulated interaction constant.
- The examples below are invented model calculations, not measured inhibition curves.
First define what is being inhibited
In peptide research, the peptide might be the substrate being cleaved or modified, the proposed inhibitor, or a reporter-bearing reagent used to follow another reaction. Those roles must remain separate. A fluorescence decrease can reflect less chemical conversion, but it can also arise because the test material changes the detector response. The phrase “peptide inhibition” does not identify the measurement or explain the mechanism.
Write the biochemical question as a relationship: enzyme E converts substrate S into measured product P, and candidate I may change that conversion. Then identify how the measured signal becomes an estimate of reaction rate. If the signal instead follows an auxiliary enzyme, antibody interaction or fluorescence pair, that detection layer requires its own checks. A lower instrument reading is an observation; inhibition of the intended target is an inference.
The Assay Guidance Manual’s enzyme-basics chapter emphasizes reaction linearity, detector calibration and the effect of substrate concentration and conversion on IC50. These are assay-development considerations, not a universal validated method for every peptide substrate. Its relevant guidance dates from 2012, rather than being a new research finding. Brooks and colleagues, technical guidance.
Describe the kinetic pattern before claiming a binding site
The enzyme-mechanism chapter distinguishes competition, uncompetition and mixed behavior. It explicitly treats competitive binding as mutual exclusion with substrate, which need not mean that both occupy precisely the same atoms in the active site. It also distinguishes allosteric binding from the resulting kinetic phenotype. Strelow and colleagues, types of inhibition.
This distinction changes how a conclusion should be phrased. “The data support competitive behavior with respect to substrate S under the fitted model” preserves the experimental result. “The compound binds exactly at S’s binding pocket” adds a structural claim. That additional claim needs evidence addressing location or contact, rather than a more confident description of the same rate measurements.
A structural experiment and a kinetic experiment may eventually support a common explanation. They are complementary because they observe different aspects of the system. A model that fits a rate surface adequately does not make every alternative microscopic mechanism impossible. Conversely, observing a binding interaction need not show what fraction of the measured biochemical inhibition it explains.
| Model | Apparent limiting rate | Apparent Km | Interpretive boundary |
|---|---|---|---|
| Competitive | Unchanged | Increases | Does not locate the binding site |
| Pure noncompetitive | Decreases | Unchanged | A special equal-factor case |
| Uncompetitive | Decreases | Decreases by the same factor | Conditional on the stated model |
| General mixed | Decreases | Can increase or decrease | Requires support for both parameters |
Use one explicit equation to make the comparison testable
For an illustrative single-substrate, reversible model, write the rate as v = V S / (a K + b S). Here V is the uninhibited limiting rate, K is its Michaelis constant, S is free substrate concentration, and a and b are dimensionless inhibition factors. In this notation, a = 1 + I/Ki and b = 1 + I/Ki′, using free inhibitor concentration I and the constants associated with the two model interactions. These a and b symbols are defined here; another source may use alpha for a ratio instead.
Rearrangement gives v = (V/b) S / ((a/b) K + S). Consequently, the apparent limiting rate is V/b and the apparent Michaelis constant is aK/b. Setting b to one gives the competitive form. Setting a to one gives the uncompetitive form. Setting a and b equal gives the pure noncompetitive form. These are mathematical restrictions within this particular model, rather than four unrelated curve labels.
Suppose two fitted factors are poorly determined but their ratio is relatively stable. The apparent Km may then look precise even though the underlying interaction constants are not. Reporting only the ratio can conceal that identifiability problem. Preserve uncertainty for the parameters needed by the mechanistic conclusion, as well as plots of the observations and residuals.
An invented example: equal inhibition at one substrate level hides different models
Choose V = 100 rate units and K = 10 concentration units. Consider a fixed inhibitor condition giving a = 3, b = 1 in a competitive model. At S = 10, the rate is 100 × 10 / (3 × 10 + 10) = 25. With no inhibitor, the corresponding rate is 50. Relative activity is therefore 50%.
Now choose a pure noncompetitive case with a = b = 2. At the same S = 10, its rate is 100 × 10 / (2 × 10 + 2 × 10) = 25. A third, uncompetitive case with a = 1, b = 3 also gives 25 at that substrate concentration. One exact, noiseless observation of 50% activity therefore fails to distinguish all three invented models.
The separation appears when the question changes. At S = 100, the no-inhibitor rate is approximately 90.91. The competitive calculation gives 76.92, the pure noncompetitive calculation 45.45 and the uncompetitive calculation 32.26. Relative to their common no-inhibitor control, activities are approximately 84.62%, 50.00% and 35.48%. More substrate makes the three stipulated models diverge even though their starting observations matched.
This example does not prescribe a concentration series. Its purpose is logical: a single substrate condition can leave mechanisms indistinguishable even when the measurement has no error. Real observations add uncertainty, detection constraints and limits on usable substrate concentrations. More precise measurement at the same uninformative point cannot replace a comparison that distinguishes the hypotheses.
Why an IC50 can move while Ki stays fixed
For the competitive restriction of the equation, the ratio to the no-inhibitor rate is (K + S)/(aK + S). Setting that ratio to one half yields aK + S = 2K + 2S, hence I/Ki = 1 + S/K. Under these assumptions, IC50 = Ki(1 + S/K). The derivation relies on the model and free concentrations, rather than merely on both quantities sharing concentration units.
As another invented calculation, hold Ki at 5 nM and K at 10 µM. If S is 2 µM, the calculated IC50 is 6 nM; at 10 µM it is 10 nM; at 50 µM it is 30 nM. The reported midpoint changes fivefold between the first and last conditions while the stipulated Ki never changes. Mixing nM and µM is acceptable here only because S/K is formed from matching units and is dimensionless.
The kinase-assay chapter discusses substrate-dependent potency shifts and the complications of ATP plus peptide or protein substrate. Its examples show why the substrate named in a mechanism matters. Competition with ATP and competition with a peptide substrate are different assertions. Glickman, mechanistic principles in kinase assays.
What a useful inhibition record should preserve
A compact record should connect the enzyme construct and active-concentration basis, full peptide-substrate identity, inhibitor identity, varied substrate, other substrates or cofactors, rate interval, response calibration, solvent composition and fitted equation. Keep all concentrations on their stated final-reaction basis. Record whether inhibitor concentration is nominal total concentration or an estimate of the free concentration used by the model.
Retain the no-inhibitor response at each substrate level. Dividing every inhibited response by one control measured at a different substrate concentration can produce an apparent interaction simply by changing the denominator. Likewise, a substrate-dependent optical background should remain distinguishable from substrate-dependent enzyme activity. A normalized plot can hide either problem when the underlying controls are missing.
For model comparison, ask which observations separate the alternatives, whether parameter intervals include competing restrictions, and whether residual patterns indicate a failed assumption. Reciprocal plots can be useful illustrations, but selecting a mechanism because lines appear to intersect at a convenient location is weaker than examining an appropriate fit to the rate observations. The model should explain the experiment rather than decorate it.
Where this simple interpretation stops
Substantial inhibitor depletion breaks the shortcut of treating nominal inhibitor as free inhibitor. Time-dependent onset makes the chosen observation interval part of the effect. Incomplete solubility can restrict the accessible inhibitor range. A plateau above the no-activity control may represent partial inhibition, but it may also reflect a detection floor or inadequate accessible concentration. Those alternatives need targeted evidence rather than an automatic label.
A two-substrate enzyme also cannot always be reduced to this single-substrate equation without specifying what happened to the second substrate. Changes in its availability or enzyme-state distribution can alter an apparent pattern. Preserve the word “apparent” when the reported constant belongs to fixed assay conditions, and avoid converting a fitted kinetic description into a universal property of a catalog material.
These boundaries do not make inhibition studies uninformative. They identify the scope of the conclusion. A defensible result may be that two candidate models remain compatible with current observations. That statement guides the next discriminating measurement more effectively than a definitive mechanism inferred from an insufficient curve.
Frequently asked questions
Does competitive inhibition prove binding at the substrate’s exact site?
No. A competitive kinetic pattern concerns mutually exclusive substrate and inhibitor behavior in the specified model. A claim about the physical contact region requires appropriate structural or other independent evidence.
Can the same inhibitor have different IC50 values?
Yes. The hypothetical competitive example changes substrate concentration while retaining the same Ki. Timing, active enzyme amount, detection and other assay conditions can also affect the observed midpoint.
Is noncompetitive inhibition another name for allosteric inhibition?
No. One describes a particular kinetic pattern; the other concerns regulation through a distinct binding interaction and conformational effects. The terms should not be substituted without evidence linking both descriptions.
Can every IC50 be converted to Ki using one correction?
No. A conversion requires the relevant mechanism, concentrations and assumptions. The competitive derivation in this article does not establish a correction for tight-binding, time-dependent or general mixed cases.
Does an inhibition curve establish peptide identity or batch quality?
It describes an assay response under stated conditions. Identity, content and impurity evidence remain separate, and none of the calculations here constitutes testing of a commercial batch.
Scope and related reading
Continue with Km versus Kd, affinity and potency endpoints, endpoint versus time-course measurements and fluorescence interference. The COA lookup is an entry to available material documentation; it does not imply that inhibition data are supplied for every product.
For laboratory research use only. This educational interpretation is not a product efficacy claim, a clinical recommendation or a validation of any specific assay.
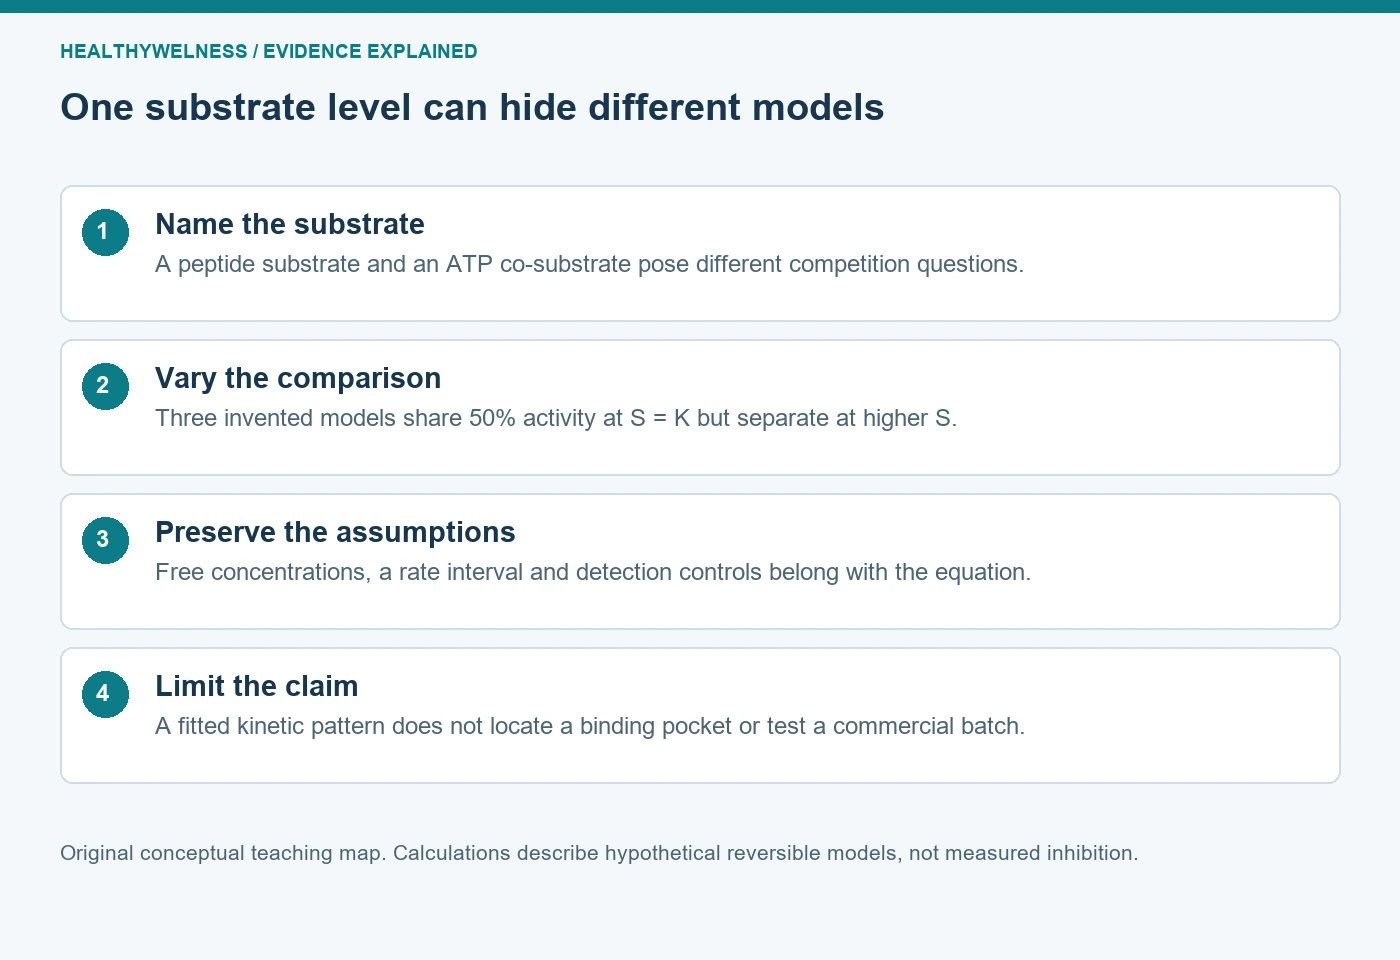
Cover and evidence map: original conceptual editorial schematics, not measured results, exact molecular structures, or photographs of HealthyWelness facilities.